From IT to Business: Using Nagios XI Host Groups Strategically
This webinar will teach you how to maximize the value of Nagios XI Host groups, streamline configuration, and gain clearer insights into system health. Learn
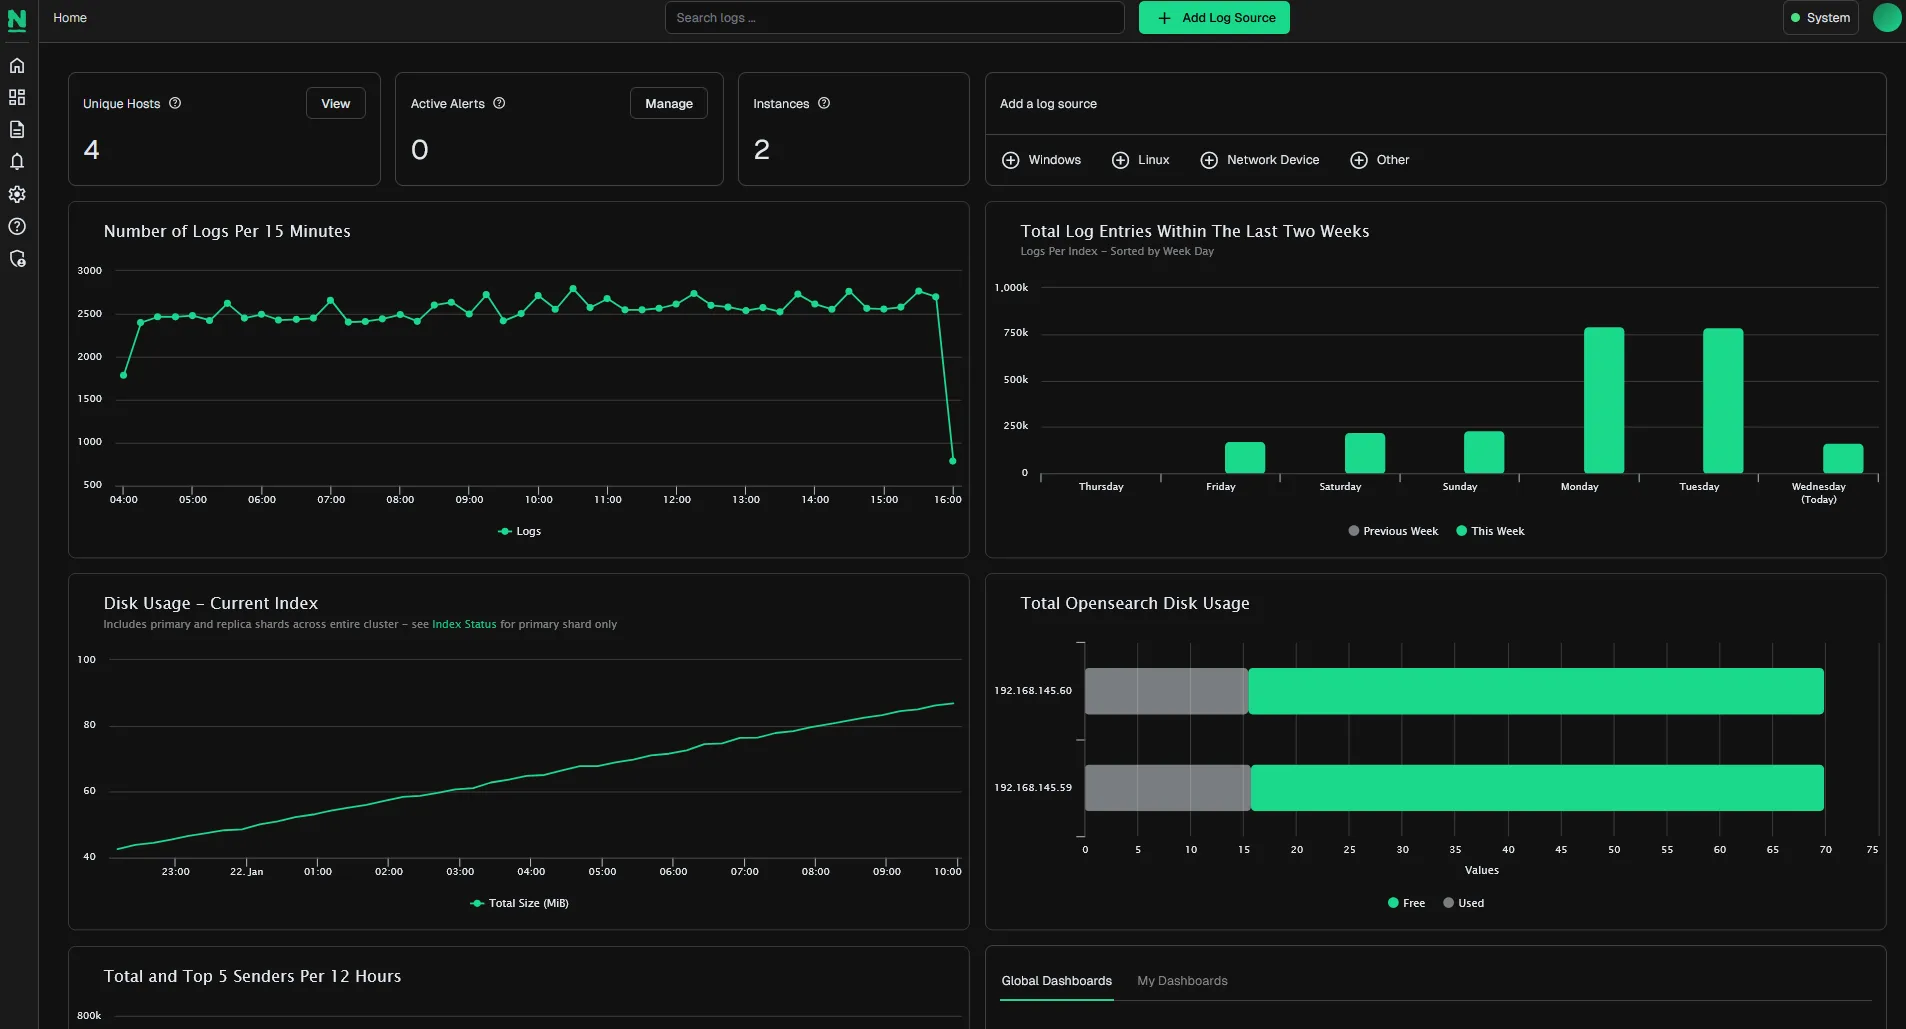
Simplify log data management with easy to setup alerts to notify you when potential threats arise. Keep all your log data accessible and safe with Log Servers high availability and failover. Effortlessly add more instances to your monitoring cluster to enhance power, speed, storage, and reliability. Meet the needs of your organization, no matter the size with Nagios Log Server.
Efficiently query, filter, and analyze incoming log events with robust dashboard tools.
Safeguard log data with a cluster of servers to prevent data loss and ensure the availability of your log information.
Create alerts based on queries with specific thresholds and send them to proper team members.
Receive log data from a designated source with just a few clicks using easy to follow step-by-step instructions.
Search with multiple queries and filters allowing you to quickly drill down to the exact problem you are searching for.
Admins can tailor the system using the backend API for limitless customization with both in-house and third-party apps.
See log data from all of your servers in real time, allowing you to analyze and solve problems as they occur.
Streamline your account management and security with a few clicks, while assigning custom roles for a secure environment.
Ask any questions you have here and one of our representatives will get back to you shortly.

This webinar will teach you how to maximize the value of Nagios XI Host groups, streamline configuration, and gain clearer insights into system health. Learn

This webinar will cover how you can migrate to the latest version of Log Server, the differences and similarities between the old and new interfaces,

Extend the capabilities of Nagios XI with integrations, including popular third-party integrations, how to install integrations, and where to make your own integrations.
Nagios, the Nagios logo, and Nagios graphics are the servicemarks, trademarks, or registered trademarks owned by Nagios Enterprises. All other servicemarks and trademarks are the property of their respective owner. Website Copyright © 2009-2025 Nagios Enterprises, LLC. All rights reserved.