SSM?
SQL Server Monitoring refers to the process of tracking, analyzing, and managing the performance, availability, and health of Microsoft SQL Server databases. SQL Server is a powerful, enterprise-grade relational database management system (RDBMS) that handles critical business data for applications, websites, and services. Monitoring SQL Server ensures that it operates efficiently, remains highly available, and that potential issues are identified and resolved before they impact business operations.
Effective SQL Server monitoring provides visibility into database performance, resource usage, and operational health, helping database administrators (DBAs) and IT teams keep their systems running smoothly.
Key Aspects of SQL Server Monitoring
1. Performance Monitoring
- Query Performance: Track slow-running queries, identify queries with high execution times, and optimize query performance. Tools like SQL Server Profiler and Extended Events are useful for capturing and analyzing query execution details.
- Wait Statistics: Monitor wait statistics (e.g., sys.dm_exec_requests and sys.dm_exec_sessions) to understand what resources SQL Server is waiting on, such as CPU, I/O, or locks. High wait times can indicate performance bottlenecks.
- Execution Plans: Review and analyze execution plans to ensure that queries are using indexes efficiently and avoiding full table scans or unnecessary joins.
- Index Optimization: Monitor index usage, missing indexes, and fragmentation levels. Poorly optimized indexes can severely impact performance, so regular index maintenance is crucial.
2. Resource Usage Monitoring
- CPU Utilization: Monitor CPU consumption to ensure SQL Server is not overloading the system. High CPU usage can indicate inefficient queries, resource contention, or inadequate hardware.
- Memory Usage: SQL Server relies heavily on memory for caching and query execution. Monitor memory usage, especially for the buffer pool (sys.dm_os_memory_clerks), to ensure that SQL Server has enough memory to work efficiently.
- Disk I/O and Storage: Track disk usage and I/O performance to identify issues like slow disk access, lack of available space, or potential hardware failures. Monitoring file growth and database sizes is also important to anticipate storage capacity issues.
- SQL Server Buffer Pool: The buffer pool is where SQL Server stores data pages in memory. Monitoring buffer pool usage helps ensure that frequently accessed data is available in memory and not repeatedly read from disk.
3. Database Health Monitoring
- Database Availability: Ensure that SQL Server databases are online and accessible. Monitoring database status (online/offline) is essential to avoid service interruptions.
- Transaction Log Monitoring: Monitor the transaction logs for signs of rapid growth, uncommitted transactions, or potential issues with log backups. Healthy log management is critical to ensure that the database can recover properly in case of failure.
- Backup and Restore Monitoring: Track regular backup operations (full, differential, and transaction log backups) to ensure that backups are completed successfully. Failing to back up data regularly can lead to data loss during a failure.
- Database Integrity: Regularly check the integrity of SQL Server databases using DBCC CHECKDB to detect any corruption in the database. Corruption can lead to data inaccessibility and potential data loss.
4. Replication and High Availability Monitoring
- Replication Status: In environments with database replication (e.g., transactional replication, peer-to-peer replication, or Always On Availability Groups), monitoring the status of replication is crucial. Replication lag, failure, or misconfiguration can result in data inconsistencies across nodes.
- Always On Availability Groups: SQL Server’s high availability feature, Always On, provides database failover and availability between multiple SQL Server instances. Monitoring the health, synchronization status, and failover readiness of Availability Groups is essential to ensure minimal downtime.
- Log Shipping and Mirroring: For setups using log shipping or database mirroring, monitoring the synchronization of the secondary database with the primary is critical to avoid data loss and ensure failover readiness.
5. Security Monitoring
- Login Attempts and Auditing: Monitor failed login attempts, especially if there is a pattern of unauthorized access attempts, which can be an indication of a security breach or attack (e.g., brute force).
- User Roles and Permissions: Ensure that users have the correct permissions for their roles. Over-permissioning can lead to potential security vulnerabilities.
- SQL Injection and Vulnerabilities: Track potential security vulnerabilities, such as suspicious SQL queries, and ensure that SQL injection attacks are prevented.
- SQL Server Auditing: Enable auditing features to track who is accessing the database, what actions they are performing, and whether any unauthorized changes have been made. You can use built-in features like SQL Server Audit or third-party tools for more detailed logging.
6. Alerting and Notification
- Threshold-Based Alerts: Set up alerts based on thresholds for various metrics such as CPU usage, memory usage, disk space, query performance, or replication lag. Alerts can be configured to notify administrators via email, SMS, or through integration with monitoring tools like Nagios, Prometheus, or Microsoft System Center Operations Manager (SCOM).
- Real-Time Notifications: Real-time alerts help administrators identify and address issues as soon as they arise, preventing performance degradation or downtime. For example, if query execution time exceeds a certain threshold or if disk space is running low, the system can notify DBAs immediately.
7. Maintenance Monitoring
- Index Maintenance: Monitor and schedule index reorganization or rebuilding based on fragmentation levels. Poorly maintained indexes can lead to slow query performance and resource contention.
- Database Cleanup: Ensure that old data, log entries, and temporary objects are regularly cleaned up to free up system resources and maintain performance.
- Autovacuum and Garbage Collection: In SQL Server, this might involve ensuring that background processes, like the Auto Shrink feature (though not recommended for production environments), are properly configured to clean up unused data and free up disk space.
8. Error and Log Monitoring
- Error Logs: Regularly monitor SQL Server’s error logs for any critical errors or warnings that might require attention, such as deadlocks, hardware failures, or configuration issues.
- SQL Agent Jobs: Monitor SQL Server Agent jobs (for scheduled tasks) to ensure that they are running correctly and completing on time. Failed jobs may indicate issues with backups, data imports, or other critical operations.
9. Third-Party Monitoring Tools
There are several third-party tools that can help enhance SQL Server monitoring with additional features, better visualization, and easier configuration:
- SQL Sentry: Offers deep insights into SQL Server performance, query execution, and resource utilization, along with advanced alerting and reporting capabilities.
- Redgate SQL Monitor: A cloud-based monitoring tool that provides real-time performance metrics, alerts, and reports for SQL Server databases.
- SolarWinds Database Performance Analyzer: Provides detailed performance monitoring, query optimization, and diagnostic insights for SQL Server.
- Nagios, Zabbix, or Prometheus: Open-source tools that can be configured to monitor SQL Server through custom plugins, providing a cost-effective solution for tracking performance, availability, and resource usage.
10. Cloud-Based Monitoring (for SQL Server on Azure)
- Azure SQL Database Metrics: If you’re using SQL Server in a cloud environment like Azure SQL Database or Azure SQL Managed Instance, Microsoft provides integrated monitoring tools like Azure Monitor, SQL Analytics, and Query Performance Insight to track performance, resource usage, and availability.
- Automated Scaling and Performance Insights: Cloud environments often offer features like automatic scaling based on demand, and built-in performance insights that can help you monitor and manage SQL Server instances with minimal manual intervention.
Benefits of SQL Server Monitoring
- Proactive Issue Detection: Monitoring helps identify issues early, such as performance bottlenecks, failed queries, or resource exhaustion, preventing downtime and improving system reliability.
- Optimized Performance: Continuous tracking of resource usage and query performance helps optimize SQL Server configurations, reduce latency, and enhance overall performance.
- Improved Security: Regular monitoring of access logs, user roles, and SQL Server activities helps identify potential security risks, preventing unauthorized access and data breaches.
- Compliance and Auditing: Ensuring proper auditing and logging capabilities helps meet compliance standards and regulations (e.g., GDPR, HIPAA).
- Cost Savings: By optimizing resource usage and ensuring SQL Server is running efficiently, businesses can reduce unnecessary hardware costs and improve the overall cost-effectiveness of their infrastructure.
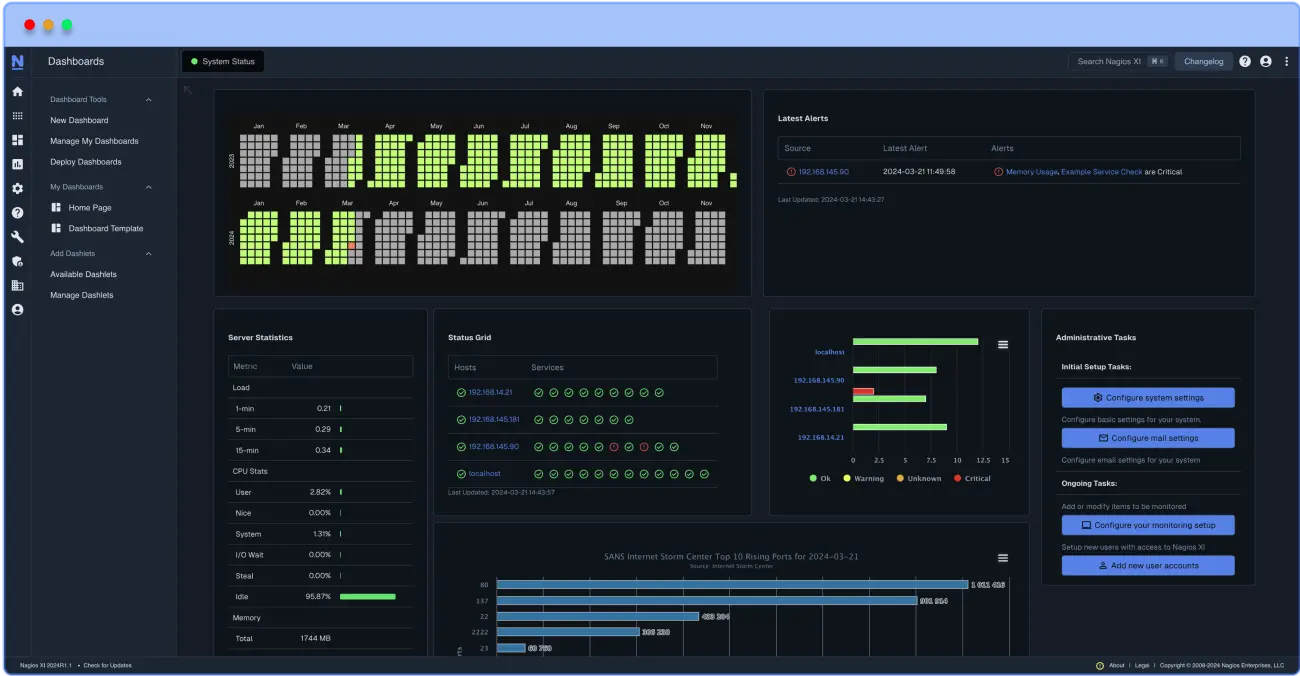
Database Monitoring Using Nagios XI
MySQL Monitoring
Nagios XI allows MySQL database managers to:
- Track table locks, replication status, and user action.
- Monitor storage engine-specific parameters.
- Ensure that queries are executed within the parameters specified.
For more information, check out MySQL Monitoring.
DB2 Monitoring
Many businesses rely on IBM DB2 to function properly. Nagio provides features for:
- Tracking database events, locks, and buffer pools.
- Monitor storage consumption and performance.
- Maintain transaction confidentiality and backup success.
For more information on Nagios plugins for monitoring IBM DB2 databases and database servers click -> Here.
How Nagios Improves SQL Server Monitoring
- Scalability: Monitor many SQL servers in hybrid settings.
- Customization: Define specifications that are customized to your company’s needs.
- Integration: Use SNMP or alternative protocols to integrate SQL into overall IT infrastructure monitoring.
- Comprehensive Insights: Organize monitoring data to get a birds-eye-view of database health and efficiency.
- Actionable Alerts: Set up notifications to minimize downtime.
Nagios’ broad plugin ecosystem and built-in capabilities make it an adaptable tool for businesses looking to improve SQL server monitoring. Whether it’s MySQL, Microsoft SQL Server, or DB2, Nagios makes sure your database is safe.
Why Use Nagios Log Server for SQL Server Monitoring?
Nagios Log Server provides centralized logging and real-time analysis, enabling efficient log aggregation and detailed insights into the operation of your SQL Server instances. It allows you to collect and analyze logs from SQL Server and other applications, helping you quickly identify issues, understand performance bottlenecks, and stay on top of security events.
Here’s how you can leverage Nagios Log Server for SQL Server monitoring:
Key Benefits of Monitoring SQL Server Logs with Nagios Log Server
- Centralized Log Management:
- SQL Server generates various logs, such as error logs, transaction logs, audit logs, and performance data. Nagios Log Server aggregates and centralizes all these logs, simplifying monitoring and troubleshooting.
- With Nagios Log Server, you no longer need to manually sift through logs on individual SQL Server instances. All logs are collected in a single interface for easy access and analysis.
- Real-Time Log Analysis:
- Real-Time Alerts: Nagios Log Server provides real-time log analysis, allowing you to create alerts based on specific log entries, such as SQL Server errors, failed login attempts, or resource constraints.
- If an event occurs (e.g., SQL Server goes down, a query execution fails, or a critical log entry is detected), Nagios Log Server can trigger notifications, allowing you to respond to issues quickly.
- Detailed SQL Server Monitoring:
- SQL Server Error Logs: SQL Server logs critical information, including errors, warnings, and deadlocks. Nagios Log Server can collect these logs and generate insights into database health, allowing DBAs to identify issues like query failures, database corruption, or connection errors.
- SQL Server Event Logs: Track SQL Server events such as login attempts, permission changes, schema changes, and database restores.
- SQL Server Performance Logs: In addition to error logs, you can collect performance-related logs, like slow-running queries, memory usage, and disk I/O, and view them in Nagios Log Server.
- Comprehensive Reporting:
- Nagios Log Server allows you to generate detailed reports from the logs, which can be helpful for auditing, compliance, or performance optimization. For example, you can create reports on SQL Server failures, query performance, or user activity.
- You can track long-term trends and analyze historical data to identify recurring issues or areas for improvement.
- Search and Querying Capabilities:
- Powerful Search: Nagios Log Server’s intuitive search functionality allows you to quickly find relevant entries from SQL Server logs, such as specific error codes, performance metrics, or even specific queries.
- Custom Queries: You can create custom queries to track specific events related to SQL Server performance, like deadlocks, connection failures, or high CPU usage events. These queries allow for targeted analysis, reducing the time needed to pinpoint issues.
- Easy Integration with Other Tools:
- Nagios Core Integration: Nagios Log Server integrates seamlessly with Nagios Core or Nagios XI, enabling you to combine real-time log monitoring with infrastructure monitoring. Alerts from Log Server can be sent to Nagios Core, where additional actions (such as service restarts or custom scripts) can be triggered.
- Third-Party Integrations: Nagios Log Server can integrate with external monitoring or incident management tools (e.g., Slack, PagerDuty, ServiceNow) for alerting and notification management.
- Security and Compliance Monitoring:
- Audit Logs: You can monitor SQL Server audit logs (e.g., failed login attempts, user access changes) to ensure compliance with security policies.
- Real-Time Alerts on Security Issues: Create alerts for suspicious activities, such as unauthorized access attempts or failed login attempts to SQL Server. This is particularly important for identifying potential security breaches.
- Historical Log Retention: Nagios Log Server provides configurable log retention policies, allowing you to store SQL Server logs for compliance and auditing purposes.
Best Practices for SQL Server Monitoring with Nagios Log Server:
- Ensure High Log Retention: Configure appropriate log retention settings in Nagios Log Server to keep SQL Server logs for a long enough period, especially if they are needed for compliance or troubleshooting.
- Automate Alerting: Set up automated responses to critical alerts, such as restarting SQL Server services when critical errors are detected or performing diagnostics when an issue is reported.
- Secure Log Data: Ensure that log data, especially security logs, is encrypted and access-controlled to prevent unauthorized access or tampering.
- Regular Health Checks: Use Nagios Core in combination with Nagios Log Server to perform regular health checks on your SQL Server instances (e.g., replication status, backup health, or database integrity checks).
- Integrate with Performance Monitoring Tools: Integrate Nagios Log Server with Nagios XI or other performance monitoring tools to get comprehensive insights into both the logs and performance metrics of your SQL Server.
Why Choose Nagios?
Nagios is one of the most widely used open-source IT monitoring systems, renowned for its reliability, flexibility, and scalability. Choosing Nagios for monitoring PostgreSQL, SQL Server, or other infrastructure components offers a range of benefits, particularly in terms of cost-effectiveness, customization, and community support.
Nagios XI offers comprehensive solutions for monitoring SQL Server, which include:
- Monitoring active connections, cache use, and database size.
- Monitor query execution as well as I/O performance.
- Ensure that high-capacity configurations are effective.
For more information, see our Nagios Knowledge Base articles on SQL Service Monitoring down below