PostgreSQL Monitoring refers to the process of tracking and analyzing various aspects of a PostgreSQL database to ensure its health, performance, security, and reliability. PostgreSQL, being a powerful and feature-rich open-source relational database system, provides several key areas to monitor in order to ensure that the database operates optimally and that any issues can be detected and addressed proactively.
Monitoring PostgreSQL effectively helps database administrators (DBAs) identify performance bottlenecks, resource constraints, query inefficiencies, replication issues, and security threats, among others. Here are the core components and capabilities of PostgreSQL monitoring:
Capabilities
1. Query Performance Monitoring
Slow Queries: Identifying long-running or inefficient queries is critical for maintaining good performance. PostgreSQL allows the capture of slow queries through the log_min_duration_statement setting or by using external tools like pg_stat_statements.
Query Execution Plans: Use EXPLAIN and EXPLAIN ANALYZE to visualize query plans and identify inefficiencies, such as full table scans or suboptimal index usage.
Index Usage: Track index hits and misses to ensure that queries are making use of appropriate indexes, avoiding unnecessary sequential scans.
Lock Contention: Monitor for locked queries or long transactions to prevent lock contention issues that could cause performance degradation.
2. Database Resource Usage
CPU Usage: Track CPU consumption by the PostgreSQL process to identify heavy operations or queries that may be consuming excessive processing power.
Memory Usage: Monitor memory consumption, especially key PostgreSQL settings like work_mem (used for sorting and hashing operations), shared_buffers (buffer cache), and maintenance_work_mem (for maintenance operations like vacuuming).
Disk I/O: Measure disk read/write activity to identify potential bottlenecks in storage subsystems. PostgreSQL writes to WAL (Write-Ahead Logs) and data files, and high disk I/O could indicate the need for hardware upgrades or more efficient configuration.
3. Database Connections and Sessions
Active Connections: Track the number of concurrent database connections, the number of idle connections, and the overall connection load. This can help in detecting connection spikes or potential exhaustion of available connections (max_connections).
Connection Pooling: Monitor connection pool usage (using tools like PgBouncer) to ensure that database connections are efficiently managed, especially in high-traffic applications.
Session Length and Abandoned Connections: Monitor for long-running or abandoned sessions that might be tying up database resources.
4. Replication Monitoring
Replication Lag: In a replicated PostgreSQL setup (e.g., streaming replication), monitor the lag between the primary and replica servers. Significant lag can lead to data consistency issues and degrade performance.
Replication Status: Use views like pg_stat_replication to monitor the status of replication, including the number of replication connections, replication delay, and the current WAL position.
Failover and High Availability: Monitor automatic failover and recovery processes in high-availability setups (e.g., Patroni or PgPool). Ensure that the failover process is functioning as expected and that the system can recover from node failures.
5. Storage Monitoring
Table Size and Growth: Track the size and growth of individual tables and indexes. This helps anticipate when additional storage capacity or database partitioning might be needed.
Disk Space Usage: Ensure that the underlying disk space for the PostgreSQL instance is sufficient to prevent issues like database crashes or slowdowns due to running out of disk space.
TOAST Tables: PostgreSQL uses a technique called TOAST (The Oversized-Attribute Storage Technique) to store large data objects like text or bytea. Monitoring the size of these objects is important for performance, as large TOAST data can cause slower queries.
6. Vacuum and Bloat Monitoring
Autovacuum: PostgreSQL uses an automatic vacuuming mechanism to clean up outdated tuples (dead rows). Monitoring the autovacuum process helps avoid table and index bloat, which can lead to degraded performance.
Dead Tuple Count: Track the number of dead tuples in tables and indexes, especially on heavily updated tables. If autovacuum is not running as expected, it may lead to significant bloat.
Table and Index Bloat: Monitor for excessive bloat, which occurs when PostgreSQL cannot reclaim space from deleted or updated rows, making tables and indexes inefficient. Tools like pgstattuple or pg_bloat_check can help in detecting bloat.
7. Transaction Management
Transaction Throughput: Monitor the number of transactions per second (TPS) to gauge database load and ensure that the system can handle the required transaction volume.
Deadlocks: Track deadlock occurrences, which happen when two or more transactions block each other in a way that neither can proceed. PostgreSQL logs deadlocks, but monitoring tools can aggregate and alert on this.
Long Transactions: Monitor long-running transactions, which can hold locks and hinder the performance of other queries.
8. WAL (Write-Ahead Logging) Monitoring
WAL Usage: Track the amount of WAL data being generated. Excessive WAL generation can indicate inefficient queries or inadequate settings for wal_level or checkpoint_timeout.
WAL Archive Status: If you’re using WAL archiving for backup or replication, monitor the status of WAL archive operations to ensure that WAL files are being properly archived and replicated.
9. Error and Log Monitoring
PostgreSQL Logs: Regularly review PostgreSQL logs for errors, warnings, and performance-related messages. Important log entries include authentication failures, query timeouts, and deadlock messages.
Logging Levels: Configure appropriate logging levels (e.g., log_min_duration_statement, log_statement) to capture sufficient information for troubleshooting without overwhelming the log files with unnecessary data.
10. Security Monitoring
User Authentication: Track user login attempts, failed authentication attempts, and changes in user roles or privileges.
Audit Logs: PostgreSQL provides extensions like pg_audit for logging detailed database activity, which is essential for compliance and security auditing.
Encryption: Monitor for proper SSL/TLS encryption for client-server communications and the use of encryption for sensitive data at rest.
11. Configuration and Parameter Monitoring
Dynamic Configuration Changes: Monitor changes to critical database configuration parameters like work_mem, shared_buffers, effective_cache_size, and others, which directly impact database performance.
PostgreSQL Statistics: PostgreSQL provides views such as pg_stat_activity, pg_stat_bgwriter, pg_stat_database, and others that provide important statistics about database health, buffer usage, background writer activity, and more.
12. Third-Party Monitoring Tools
pgAdmin: A widely-used PostgreSQL management tool that provides basic monitoring features such as query statistics and server status.
Prometheus + Grafana: These tools, when combined with pg_exporter, provide a powerful open-source solution for visualizing PostgreSQL metrics and creating detailed dashboards.
Datadog: A commercial monitoring solution that integrates with PostgreSQL to provide detailed metrics and alerting based on database performance.
Zabbix: Another open-source tool that can be configured to monitor PostgreSQL metrics, with pre-built templates for database monitoring.
New Relic: Provides performance monitoring for databases, including PostgreSQL, with an easy-to-understand user interface and advanced alerting.
13. Alerting and Automated Actions
Thresholds and Alerts: Set thresholds for key metrics such as CPU, memory, disk space, slow queries, or replication lag. Automated alerts (email, Slack, SMS) can notify administrators of issues in real-time.
Automated Recovery Actions: Configure actions to automatically resolve common issues, such as restarting a service when resource limits are exceeded or scaling up the infrastructure when thresholds are breached.
Key Features of Nagios for PostgreSQL Monitoring
Comprehensive Database Monitoring: Keep track of essential PostgreSQL metrics, including connection status, database size, table sizes, and relation sizes, to maintain a clear overview of your database health.
Custom Query Monitoring: Execute specific SQL queries against your PostgreSQL databases to monitor custom metrics and receive alerts based on query results, allowing for tailored monitoring solutions.
Integrations with Third-Party Tools: Enhance your monitoring capabilities by utilizing plugins like check_postgres, which offers a wide range of checks, including database bloat detection and replication lag monitoring.
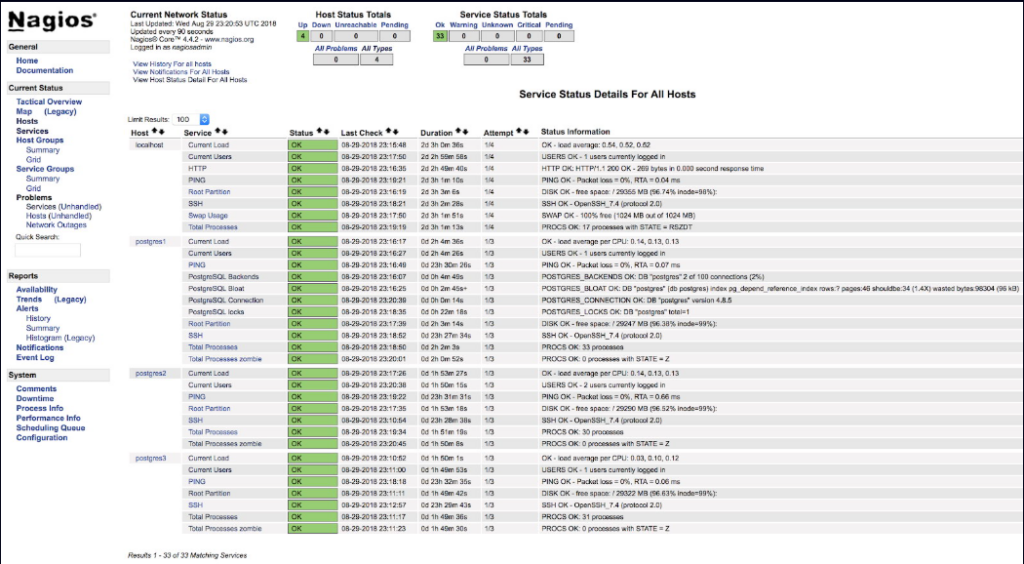
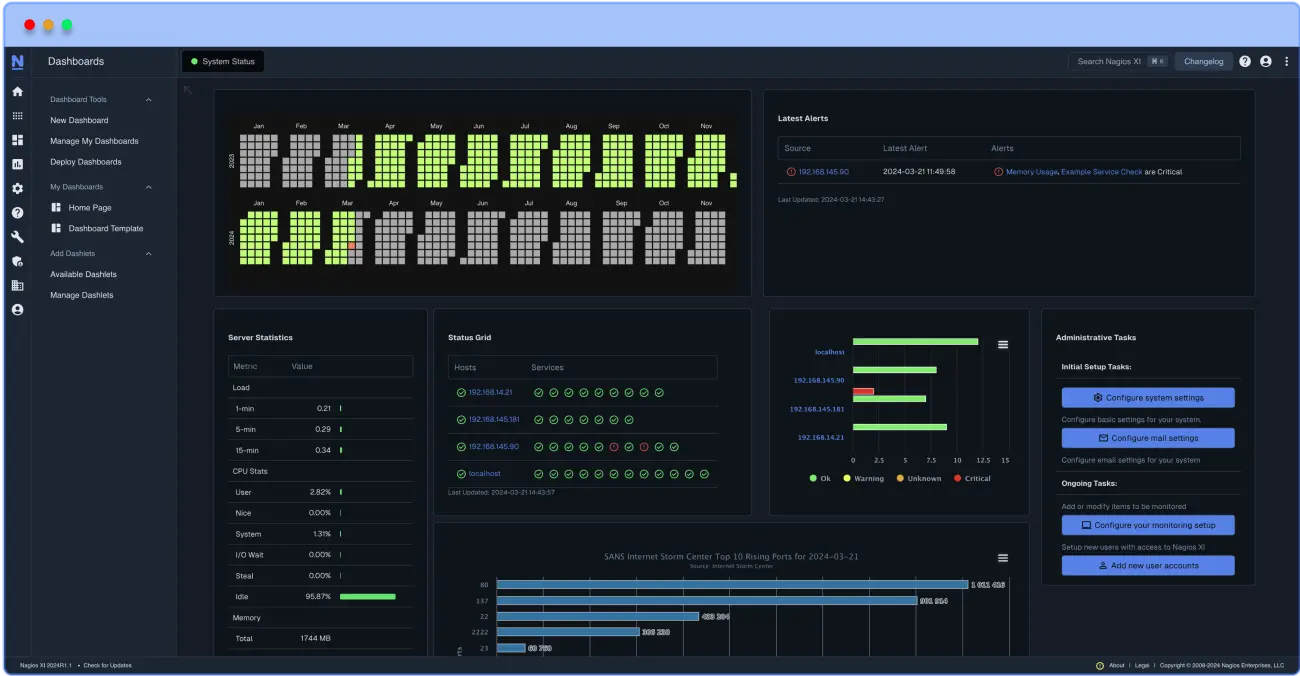
Here is an image showing how PostgreSQL will look in the UI
Cost Affective
You can save money using Nagios for PostgreSQL monitoring, especially if you’re already leveraging Nagios as part of your existing infrastructure or looking for a cost-effective solution. Here’s how using Nagios for PostgreSQL monitoring can help you reduce costs:
1. Open-Source & Free to Use
No Licensing Costs: Nagios Core, the open-source version of Nagios, is free to use, which can be a significant cost-saving factor compared to commercial monitoring solutions. You can monitor PostgreSQL without incurring any licensing or subscription fees, unlike proprietary solutions which often require per-server or per-database pricing.
Free PostgreSQL Plugins: Nagios offers free plugins for PostgreSQL monitoring (e.g., check_postgres, check_pgactivity). These plugins provide deep insights into your PostgreSQL server without requiring additional paid modules.
2. Centralized Monitoring for Multiple Services
Monitor PostgreSQL and Other Systems: Nagios can monitor not just PostgreSQL but also other parts of your infrastructure (e.g., web servers, application servers, network devices, and more). By using Nagios for all your monitoring needs, you consolidate your monitoring system into a single platform, which reduces the need for multiple, expensive monitoring solutions.
Scalability without Extra Costs: Nagios can scale to monitor many servers, databases, and services without adding significant costs. As your infrastructure grows, you don’t need to pay extra licensing fees per additional PostgreSQL instance or server.
3. Customizable Alerts and Notifications
Proactive Alerts: Nagios can send alerts about performance issues, replication lag, high query times, or server downtime, allowing you to address issues before they cause significant problems. This proactive monitoring can reduce the risk of costly downtime and performance degradation.
Cost-Effective Alerting Channels: Nagios supports multiple alerting methods like email, SMS, or even integrations with free services like Slack. Unlike some commercial monitoring systems that charge extra for premium alerting channels, Nagios provides these capabilities at no additional cost.
4. Reduced Downtime and Performance Optimization
Faster Issue Detection: Nagios helps detect performance bottlenecks and database issues early (e.g., slow queries, database bloat, connection overload). By addressing these issues proactively, you can avoid costly downtime or slowdowns that impact users or customers.
Database Optimization: With monitoring insights into query performance, index usage, and resource consumption, you can optimize your PostgreSQL queries and configurations. This can lead to improved performance and potentially reduce the need for hardware upgrades or additional resources.
5. No Vendor Lock-In
Freedom from Vendor Costs: Since Nagios is open-source, you’re not locked into proprietary vendor ecosystems that often come with costly renewals, support plans, or contract obligations. You have full control over your monitoring setup, including the ability to customize, expand, or integrate with other systems without incurring additional costs.
Flexibility to Choose the Right Add-Ons: If you need additional features, such as advanced reporting or enhanced visualizations, you can opt for third-party integrations with free or inexpensive tools like Grafana for dashboards, without having to pay a premium for integrated features in a proprietary monitoring tool.
6. Cost-Effective Alerting and Event Management
Automated Recovery Actions: Nagios allows for automated event handling, such as restarting a service, sending alerts, or even executing scripts to handle routine database issues (e.g., vacuuming tables). By automating responses to common problems, you reduce the time spent on manual intervention, thereby cutting down on labor costs.
No Premium Features for Basic Functionality: Unlike some commercial PostgreSQL monitoring solutions that lock basic functionality behind a paywall, Nagios provides comprehensive monitoring features without requiring you to purchase “premium” licenses or upgrades. You can get full database insights and actionable alerts without paying extra for essential monitoring features.
7. Efficiency and Resource Utilization
Lower Hardware Requirements: Nagios can run efficiently on relatively low resource systems, reducing the need for dedicated monitoring hardware or high-end servers. This means you can save money on infrastructure, especially in smaller environments or startups.
Minimal Overhead: Nagios introduces minimal overhead to your system, so you won’t need to invest in high-spec servers just to support a monitoring system, as might be the case with more complex enterprise monitoring solutions.
8. Community Support and Documentation
Open-Source Community Support: Nagios has a large and active community that provides free support through forums, documentation, and online resources. You can often find solutions to issues without needing to purchase a support contract, as would be required with paid monitoring services.
Extensive Documentation: The availability of documentation and tutorials means you can set up, configure, and troubleshoot Nagios and PostgreSQL monitoring with minimal need for external consulting or training costs.
9. Integration with Existing Tools
Integration with Existing Infrastructure: Nagios can easily integrate with your existing tools (e.g., Slack, email, or SMS) for notifications, or with monitoring dashboards like Grafana for better visual insights. This integration means you don’t have to purchase additional software or licenses to get a fully featured monitoring setup.
Third-Party Add-Ons: If needed, Nagios integrates well with third-party tools for enhanced functionality (e.g., Prometheus for time-series data collection, or Grafana for advanced dashboards). Many of these tools are open-source and free, helping you expand your monitoring capabilities without incurring extra costs.
10. Cost-Efficient Scaling
Horizontal Scaling: As your infrastructure grows (e.g., adding more PostgreSQL servers or databases), Nagios can scale horizontally to monitor additional systems without dramatically increasing the cost. You can extend your monitoring setup by simply adding more nodes to Nagios without having to pay more for each new instance.
Low Maintenance Cost: Nagios doesn’t require significant ongoing maintenance costs compared to some commercial solutions, where you may need to upgrade licenses or pay for ongoing software support.
Conclusion:
By leveraging Nagios for PostgreSQL monitoring, you can achieve significant cost savings through:
Free open-source software that doesn’t require costly licenses.
Consolidation of your monitoring stack (PostgreSQL and other infrastructure services) into one solution.
Automated alerts that help you address issues before they result in expensive downtime.
Low hardware and infrastructure overhead, which allows you to keep costs down.
Overall, Nagios provides a robust and flexible PostgreSQL monitoring solution that can save you money on software licenses, infrastructure, and labor costs, especially if you’re able to take full advantage of its open-source nature and powerful customization options.
By leveraging these tools and resources below, you can establish a robust PostgreSQL monitoring system within Nagios, ensuring your database operations remain efficient and reliable. Check_postgres Plugin: A versatile plugin for monitoring PostgreSQL databases with Nagios, offering a wide range of checks to suit your monitoring needs
Related Resources
No related resources found.
Nagios XI
Save Time. Save Money.
Reduce downtime and boost efficiency with proactive monitoring to ensure your systems run smoothly.