Nagios XI

Nagios XI: IT Infrastructure & Network Monitoring Software

Monitoring that stays running.

Nagios XI delivers granular alerting, customizable dashboards, and fast root-cause analysis so your team stays ahead of downtime.

Free 30-day trial with the full feature set. Installs on your own server, on premises.

Trusted by 10K+ Teams Worldwide

Boeing JPMorgan Chase Airbnb Panasonic Cisco Bose Burlington Verizon Paypal
monitoring engine

What is Nagios XI?

Nagios XI is commercial IT infrastructure monitoring software that runs on a Linux server you own. It executes plugins against your Hosts and Services on a fixed interval, compares each result against the Warning and Critical ranges you set, records the outcome, and notifies the contacts you assigned. Nagios Core is the open source monitoring engine underneath it. Nagios XI adds the web interface, Configuration Wizards, the database, reporting, dashboards, and the API.

Nodes and Services

A Node, also called a Host, is anything with an IP address or fully qualified domain name. Services are the individual checks you run against it, and there is no limit on how many.

Checks and thresholds

Every check returns OK, Warning, Critical, or Unknown by comparing a measured value against ranges you set. Nothing is guessed and nothing is inferred.

Notifications and actions

State changes reach the contacts you assigned, escalate when nobody responds, and can run a script that fixes the problem without waking anyone.

data collection

Agent-based & agentless monitroing for linux, windows, and network devices

How a metric leaves a machine is your choice, and most environments need more than one answer. Nagios XI ships four transports, and the Configuration Wizards set up whichever you pick.

One agent, every platform

Nagios Cross-Platform Agent (NCPA)

One agent for Linux, Windows, macOS, and AIX. It listens on port 5693, authenticates with a token, and serves metrics over HTTPS, so the same check command works everywhere. Its web interface browses what a machine exposes in real time, which is how you find the path before building the Service.

  • Inexpensive to execute. check_ncpa is a compiled C binary, so the monitoring server spends less on each check and carries more of them.
  • Active or passive. XI polls the agent, or the agent submits results itself when the network only runs one way.
Installing NCPA
The NCPA web interface listing available metrics on a monitored machine
Already deployed

NRPE and NSClient++ for agents you already run

Nagios Remote Plugin Executor (NRPE) listens on port 5666 and runs plugins that live on the remote machine, which is what you want when a check has to execute locally. On Windows, NSClient++ covers the same ground through check_nrpe and check_nt.

  • Keep what you have. An existing NRPE rollout migrates without replacing the agent on every machine first.
Monitoring Hosts Using NRPE
Step 2 of the NRPE Configuration Wizard selecting checks to add
Nothing to install

SNMP, WMI, WinRM, and SSH monitoring without an agent

Some devices will never take an agent, and some teams will never allow one. XI polls SNMP on port 161 and receives traps on 162, queries Windows over WMI or WinRM, and runs checks over SSH. Switches, routers, firewalls, and sensors are almost always SNMP, which makes this the usual route for network device monitoring.

  • Find the OID first. The SNMP Walk Wizard browses a device and groups what it returns by interface or MIB name, so you pick rather than guess.
  • Windows without a footprint. WMI and WinRM reach services, event logs, and performance counters for Windows server monitoring where policy forbids installing anything.
Integrating SNMP Traps With Nagios XI
The SNMP Walk Wizard listing discovered OIDs grouped by interface
Results that arrive

Passive checks through NRDP and NSCA

Not everything can be polled. A site behind someone else's firewall, a batch job that finishes at 03:00, a script that already knows the answer. Nagios Remote Data Processor (NRDP) accepts results over HTTP and HTTPS on ports 80 and 443 with a token you issue and can revoke. Nagios Service Check Acceptor (NSCA) does the same over port 5667.

  • No inbound route required. NRDP uses ports already open in most networks, so monitoring a site you cannot reach into rarely needs a firewall change.
  • Results before configuration. A passive result for something XI does not know about lands under Unconfigured Objects, so you build the Service from what arrived.
NRDP Overview
The Unconfigured Objects page showing passive results awaiting a Service definition

Nagios XI supports every route on one server, so a mixed environment does not become two monitoring systems.

guided setup

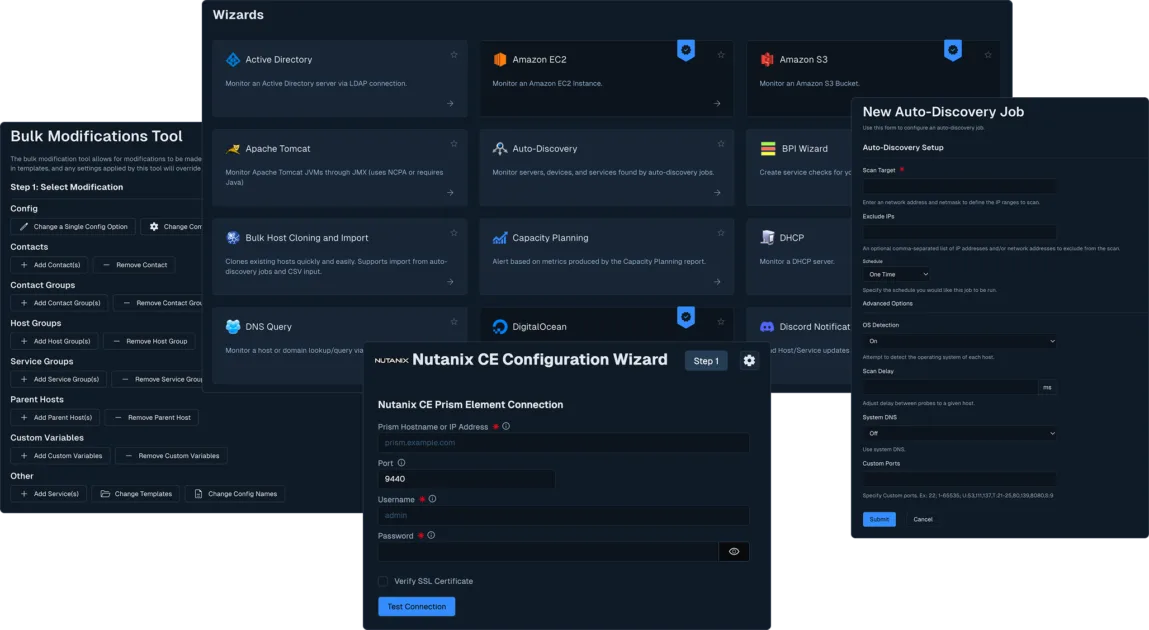
90+ Configuration Wizards & Auto-Discovery

Nothing kills a monitoring project faster than trying to hand-write every definition.

Nagios Configuration Wizards asks what you want to monitor, shows you what it found on the device, and writes the Host and Service definitions for you. No configuration file, no restart by hand.

configuration wizards nagios xi
Find what nobody documented

An Auto-Discovery job scans a subnet using ping and nmap and returns what answered. Feed those results straight into a Configuration Wizard and the switch somebody racked two years ago gets monitored alongside the servers you built yourself. Jobs run from Configure > Configuration Tools > Auto-Discovery.

Wizards for what you actually run

Linux and Windows servers, switches and routers, VMware vSphere, Hyper-V, Proxmox VE, Nutanix CE, XCP-ng, Docker container monitoring, Kubernetes, Red Hat OpenShift, SQL Server database monitoring, MySQL, Oracle, Postgres, MongoDB, Microsoft 365, Amazon EC2 and S3, Microsoft Azure, Google Cloud, and Akamai Cloud, among others. Each one asks for credentials, shows you what it found on the target, and lets you pick the checks and thresholds before it writes anything.

Some Wizards require active Maintenance & Support benefits. Those are listed as Premium features.

Anything a plugin can check

A Nagios plugin is any executable that returns an exit code and, optionally, performance data. Write it in bash, Python, PowerShell, Perl, or a compiled language, and XI will run it, graph it, and alert on it like anything else. The Generic Plugin Wizard wraps a plugin you wrote into the same interface as the shipped Wizards, so the people who use the monitoring system do not have to know it was custom.

Thousands more plugins are published by the community on Nagios Exchange. Community plugins install separately from XI and are maintained by their authors.

Change it later without starting over

Configuration snapshots record the state of your configuration so you can compare two points in time and roll back the change that broke things. The Core Config Manager edits Hosts, Services, templates, and time periods directly when a Wizard is not the right tool.

The Enterprise Edition adds bulk modification across thousands of objects at once, and a Bulk Renaming Tool that keeps historical performance and alert data attached to the renamed object rather than orphaning it.

TACTIAL DISPLAY

Smart Dashboards, status views, & Performance Graphs

Build the view each team needs from dashlets, set it as their home page, and put the wall display on rotation.

Smart Dashboards

Build a view from graph, bar chart, gauge, pie chart, statistic, treemap, data table, alert heatmap, text, and URL dashlets, filtered to the Hosts, Services, or groups that team owns. Administrators can deploy a dashboard to other users or publish it globally, and any Smart Dashboard can be set as a user's XI home page so the first screen after login is already the right one.

Performance graphs and trends

Any plugin that returns performance data is graphed from its first check, with no extra configuration. Graph Explorer stacks metrics from different Hosts on a shared axis for comparing a cluster against itself, and the underlying data downloads as CSV when the question belongs in a spreadsheet.

Status pages and network maps

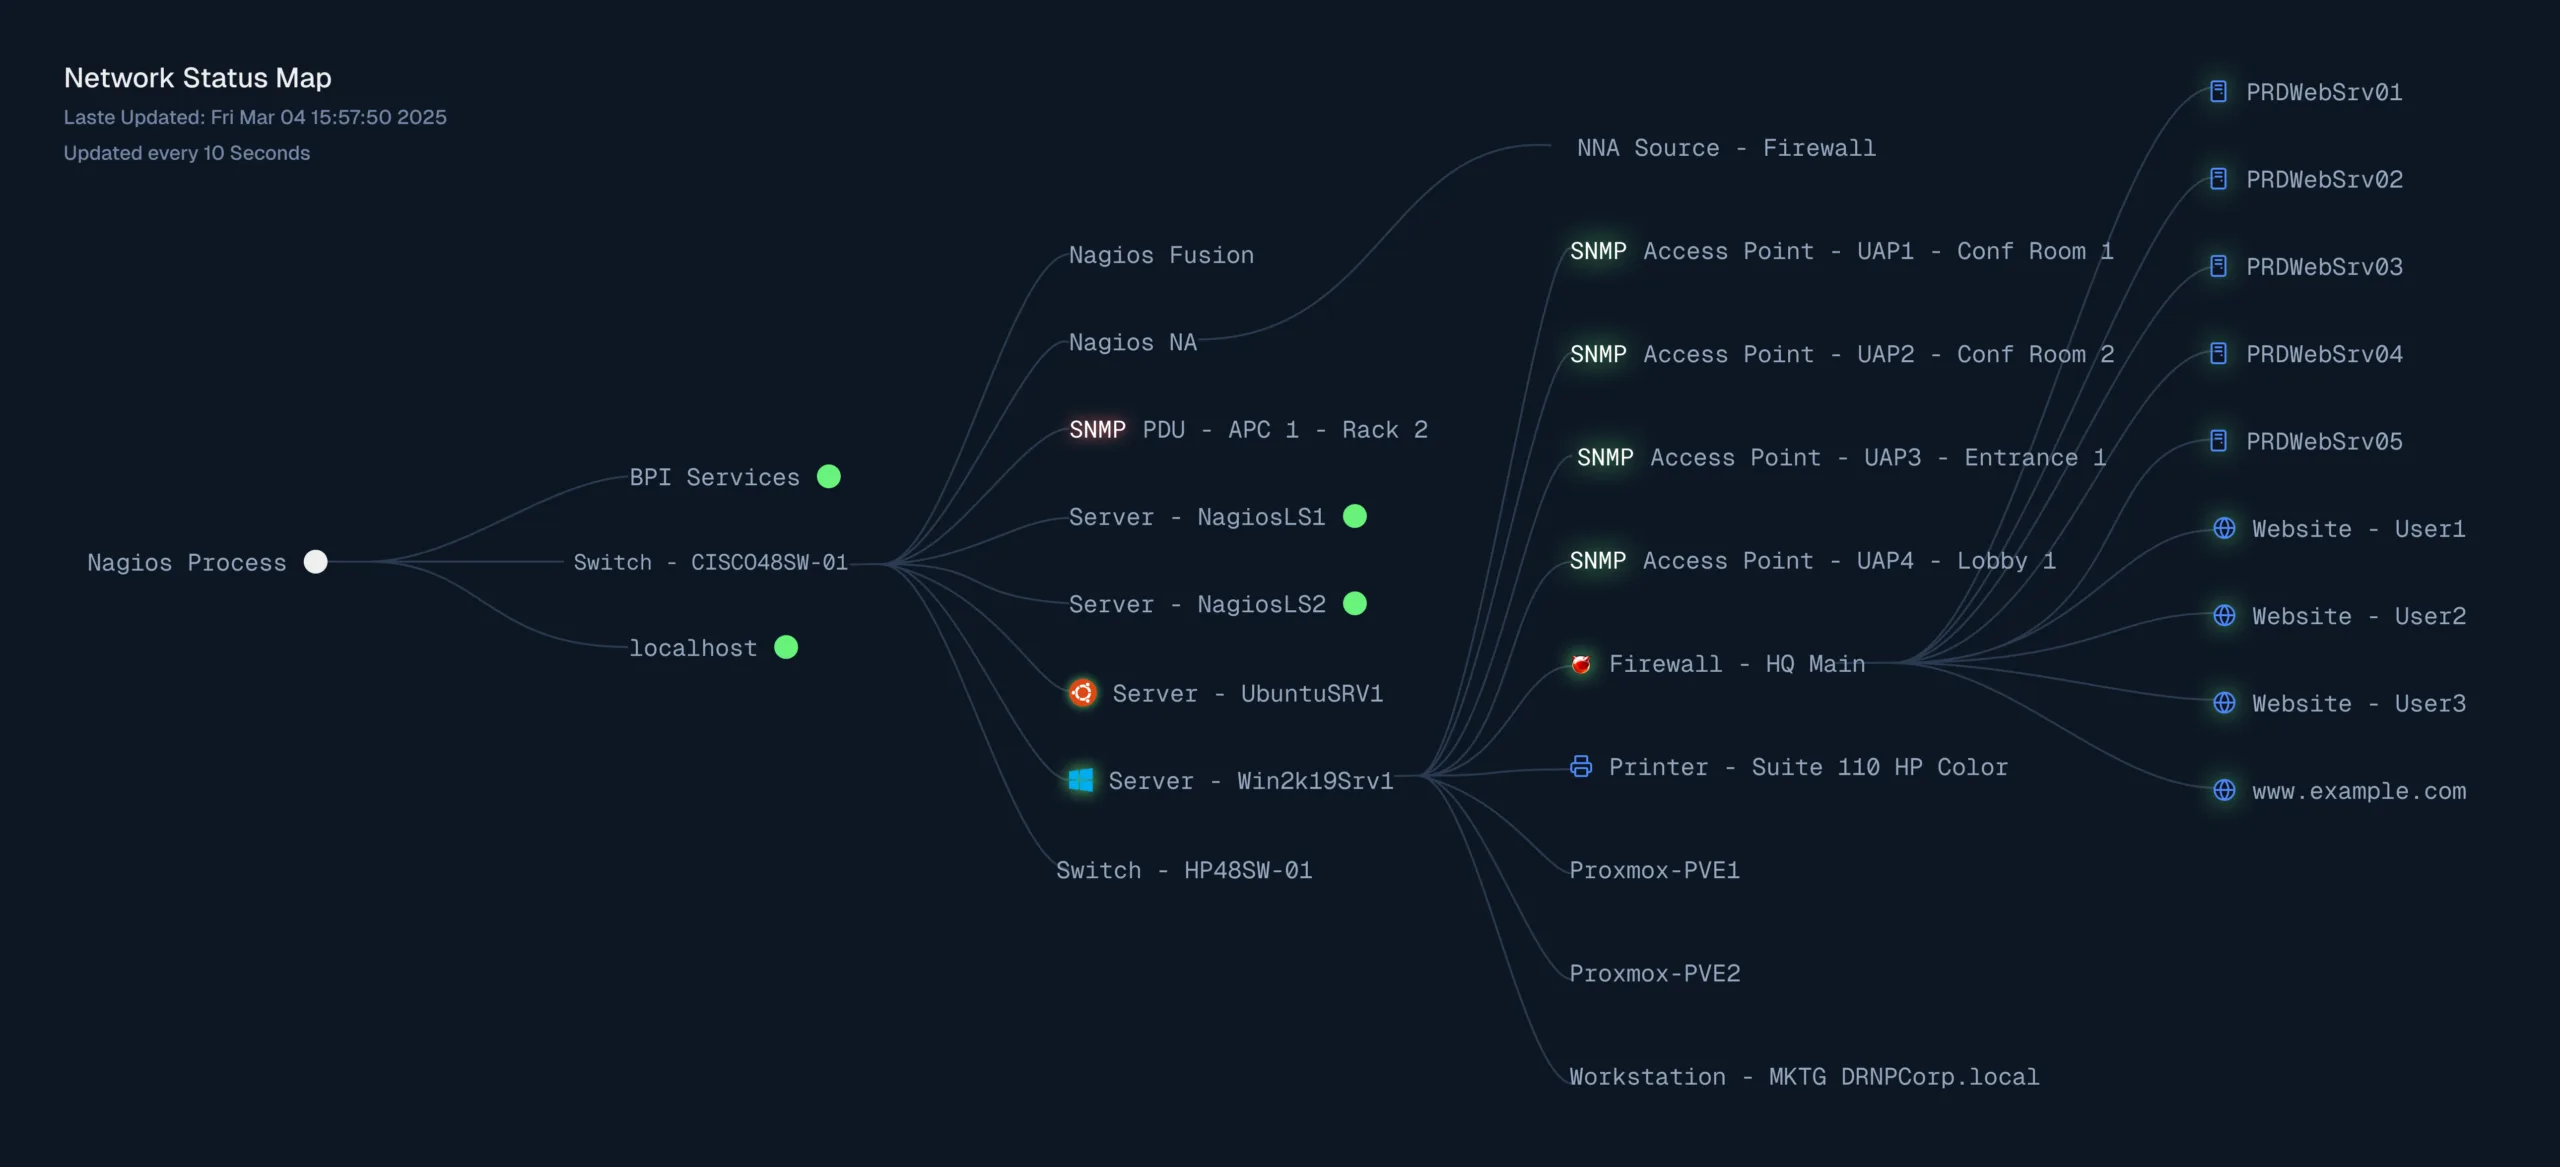
Host and Service status pages filter by group, state, and text. NagVis draws your own topology over a background you supply, and supports custom actions from a map shape. The Network Status Map lays devices out by parent relationship, and the World Map places them by coordinates.

Views for a wall display

A View rotates dashboards, status pages, and external URLs on a timer. Combined with Automatic Login, a screen in the operations room comes back on its own after a reboot without anyone typing a password into it.

notification path

Threshold-based alerting, escalations, and automated remediation

Nagios XI compares each check result against the Warning and Critical ranges you set. What happens next is configurable at every step, which is how a monitoring system stops producing alerts nobody reads.

Notifications on your terms

Email, SMS through Twilio or a Multi-Tech modem, Slack, Discord, and SNMP traps out to another management system. Time periods decide when each contact is reachable, so the overnight rota is a property of the contact rather than something a person has to remember.

Acknowledging a problem or scheduling downtime stops the repeat notifications for something a human is already dealing with.

Escalations when nobody responds

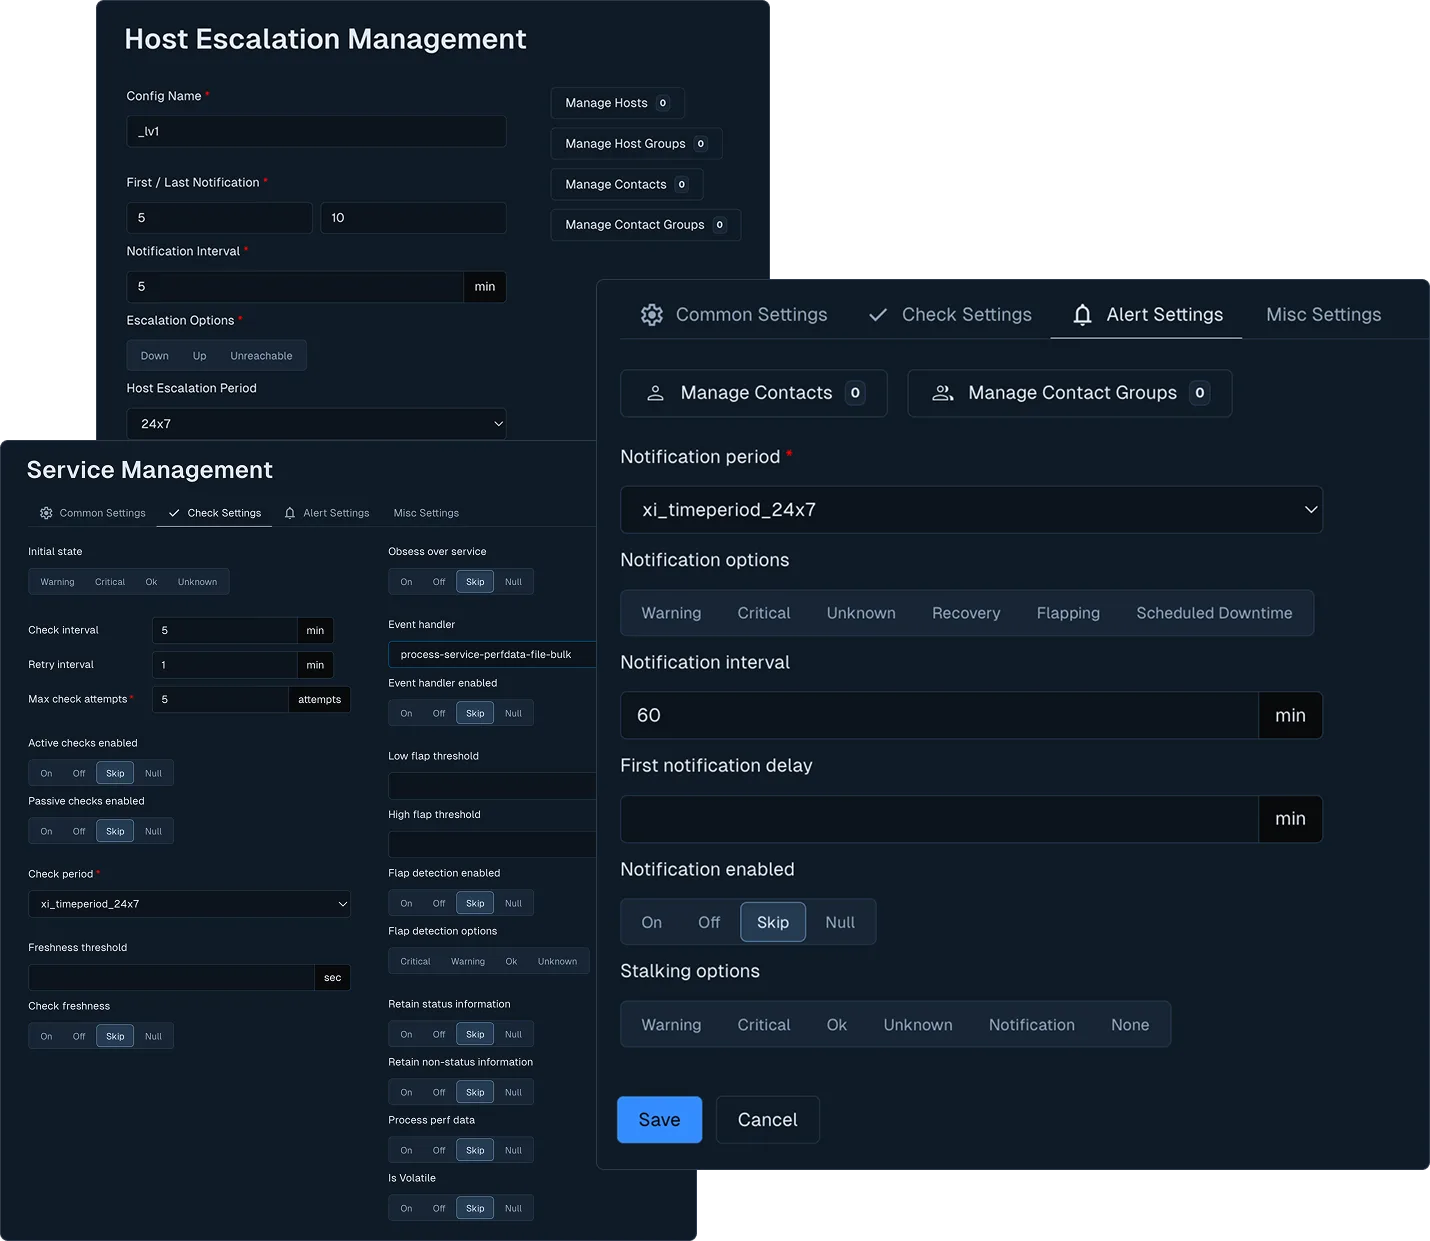
A Host or Service escalation moves the notification to a different contact group after a set number of notifications have gone unanswered. The help desk hears about it first, the on-call engineer hears about it if nothing changed, and the manager hears about it if that did not work either.

An escalation overrides the notification options and contacts set on the object while it is in effect. Set escalations up knowing they take priority over what the Host or Service says.

Event handlers that fix it first

An event handler is a script or executable XI runs when a Host or Service changes state. Restart the service, clear the spool, bounce the interface, open a ticket. XI passes the state and the state type into the script, so an event handler can act only on a HARD Critical and ignore the SOFT states that a single failed check produces.

That distinction is the difference between automated remediation and a service that restarts every time the network hiccups.

Keeping the alert stream worth reading

Notifications only go out after a Service reaches a HARD state, so a transient failure does not page anyone. Dependencies suppress the twenty alerts that follow one switch going Down. The Enterprise Edition adds Deadpool settings, which remove configuration for Hosts and Services that have sat in a problem state long past the point of being informative.

event handlers host service escaltionpng
evidence

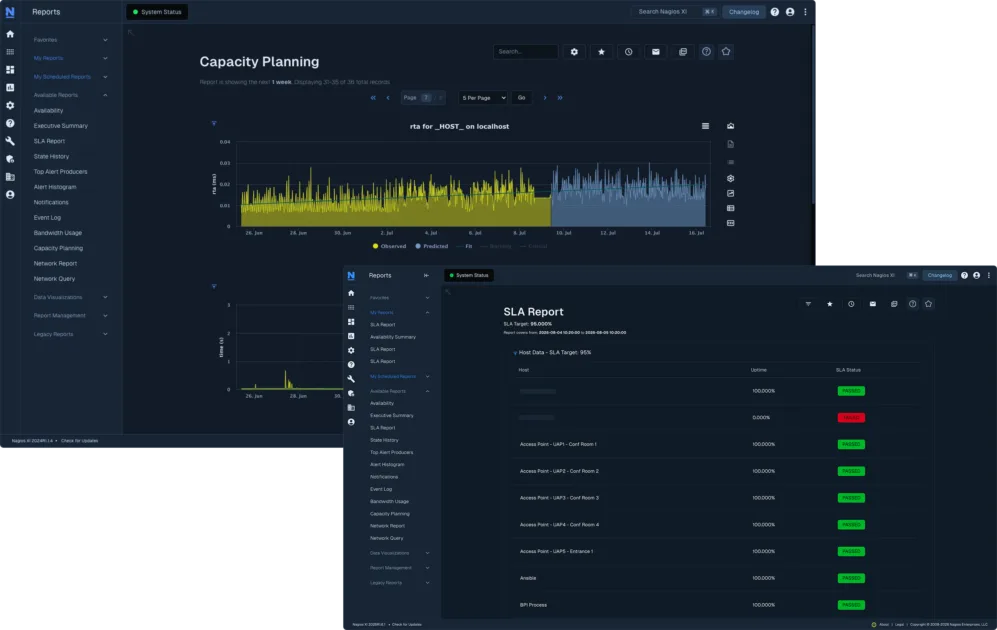
SLA reports, capacity planning, & Scheduled Reports

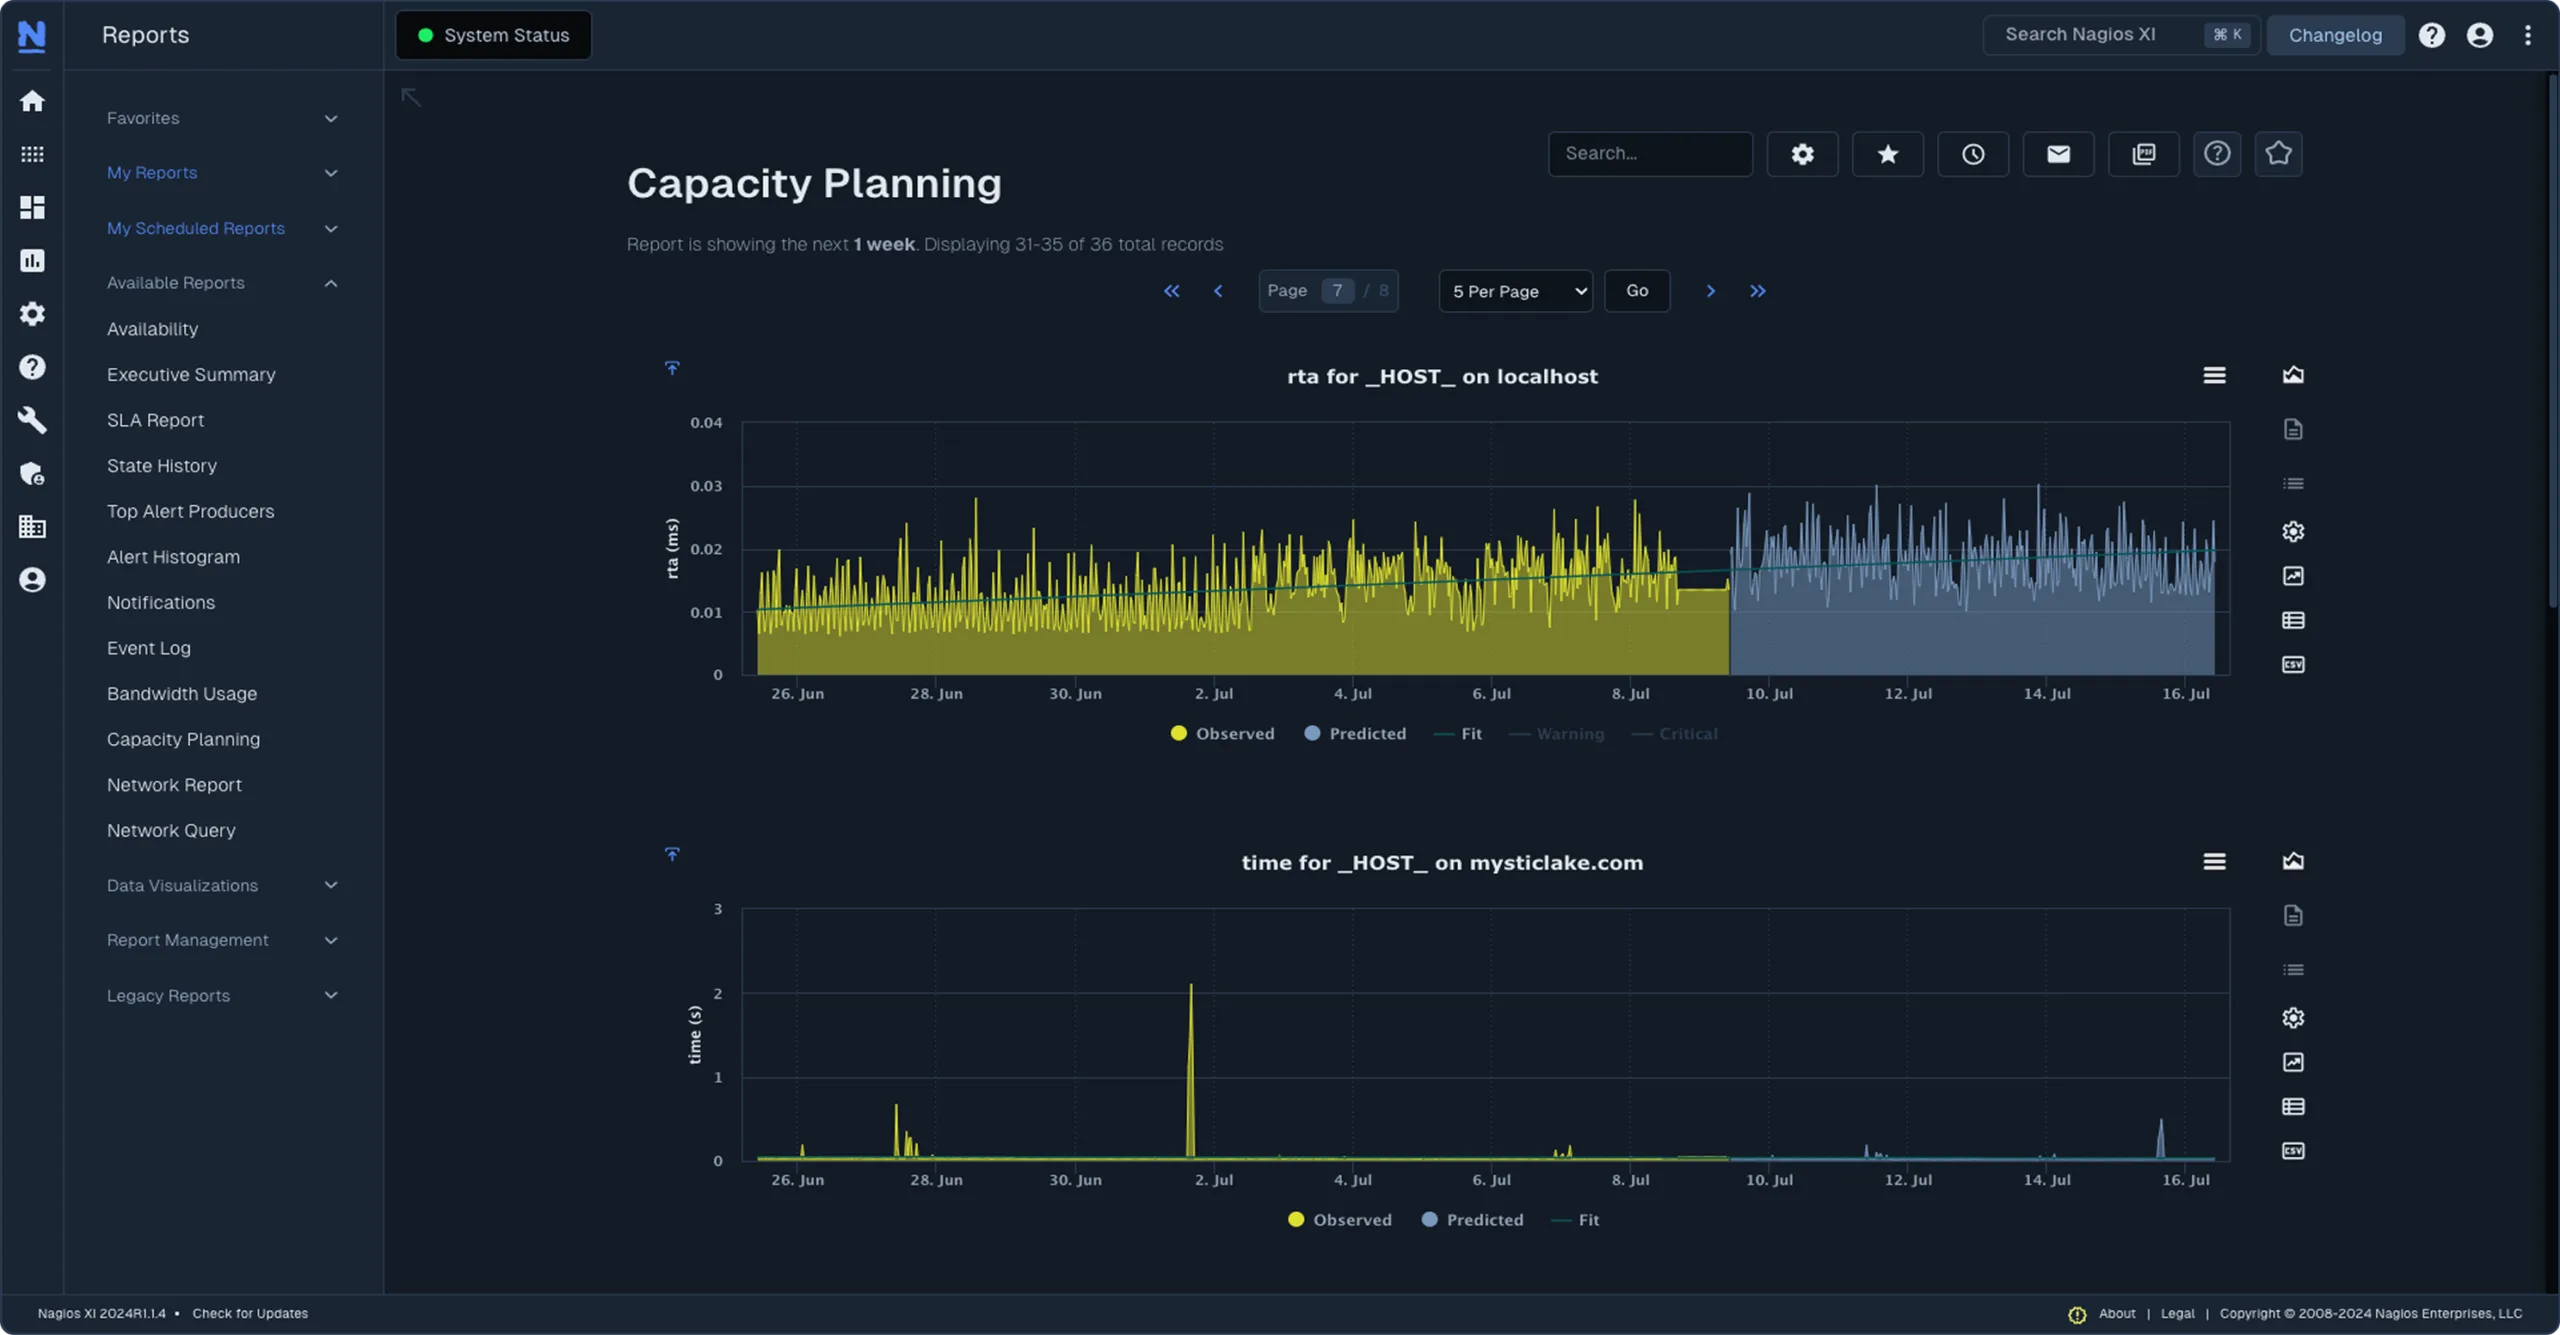
State history and performance data start accumulating on the first check, whether or not anyone asks for a report. When the question arrives, the answer is already recorded.

capacity planning sla report
CapabilityStandardEnterprise
Configuration Wizards, Auto-Discovery, dashboards, graphsIncludedIncluded
Configuration rollback and snapshotsIncludedIncluded
Availability, bandwidth usage, and executive summary reportsIncludedIncluded
Scheduled reports and scheduled pagesNot includedIncluded
Service-Level Agreement (SLA) reportNot includedIncluded
Capacity PlanningNot includedIncluded
Advanced Business Process MonitoringNot includedIncluded
Bulk modification, renaming, and notification settingsNot includedIncluded
Audit Log and Deadpool settingsNot includedIncluded
SNMP Trap InterfaceNot includedIncluded

Explore In More Detail: Nagios XI Edition Comparison

For Large organizatons

Mission-Critical Enterprise Network Monitoring

Nagios XI supports multiple monitoring architectures for large and distributed environments. Choose the model that fits how your network is built.

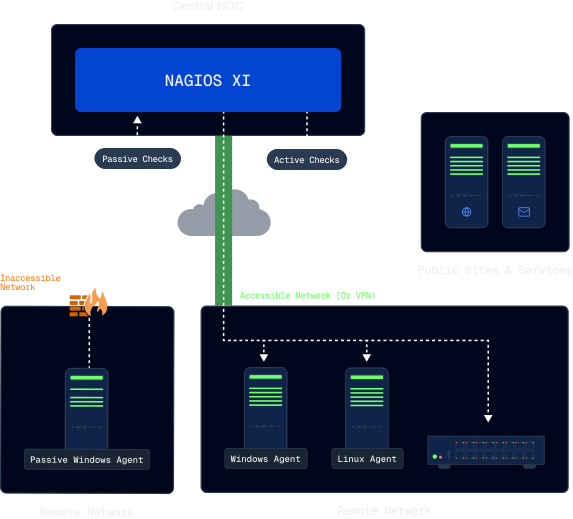
Central NOC

Centralized Monitoring

One Nagios XI server monitors everything, so configuration, notifications, and reporting all live in one place. Passive agents reach remote servers and public services that sit behind a firewall you cannot open.

  • Passive agents monitor servers that cannot be reached directly
  • Host and Service group permissions separate teams on one install
  • Centralized management, notifications, and reporting
  • Some administrative tasks stay with central NOC staff
An architecture diagram of Nagios centralized monitoring

Distributed Networks

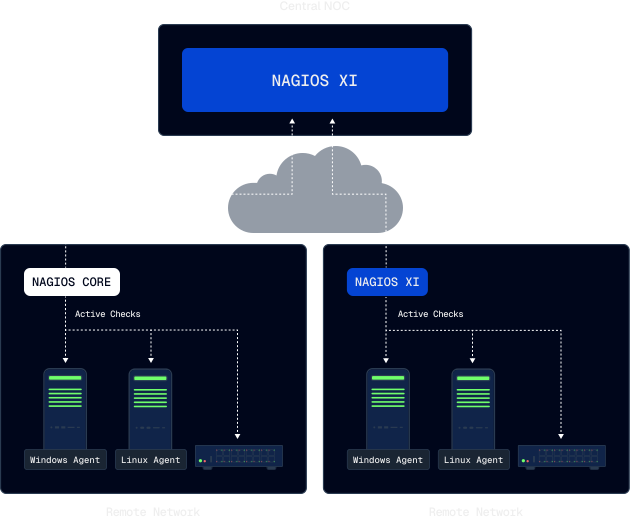
Federated Monitoring

Each site runs its own Nagios server and monitors locally, then sends status data back to a central system. Local teams get full administrative access to their own instance, and the NOC still sees every site in one view.

  • Distributed monitoring and reporting
  • Results forwarded inward through NRDP or NSCA
  • Notifications configured separately for each NOC team
  • Administrative access for local staff at each site
An architecture diagram of Nagios federated monitoring

High-Performance Scale

Scale Your Network Monitoring
With Load Balancing

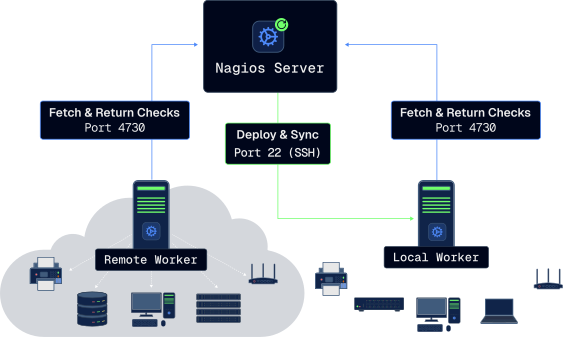
Nagios Mod-Gearman hands check execution to worker servers instead of running everything centrally. Workers connect to the queues on the Nagios XI server and pull work from them, so a remote site needs no inbound route, and alerting stays in one place.

  • Local check execution with centralized alerts and visibility
  • Reduced load on the central server through load balancing
  • Add workers for more checks, or target a queue at one segment
  • No inbound access required for remote sites
Nagios Mod-Gearman is pre-loaded in Nagios XI 2024R2.1 and later. Configuring remote workers from the interface, under Configure > Remote Workers, is a Premium feature and requires active Maintenance & Support benefits.
An architecture diagram of Nagios Mod-Gearman monitoring

Single pane

Every Nagios Server,
One Screen.

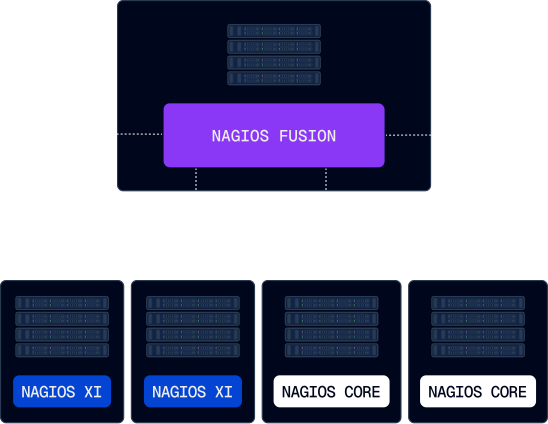
Once each site runs its own server, Nagios Fusion aggregates their status, alerts, and reports into one view. Fused servers can be Nagios XI, Nagios Core, or Nagios Log Server instances, so an operations team watches every site without logging into each one in turn. Licensed separately from Nagios XI.

An architecture diagram of Nagios Fusion monitoring
TACTIAL DISPLAY

Self-hosted deployment, including air-gapped networks

Nagios XI installs on a Linux server you own. Where that server sits, and whether it ever reaches the internet, is your decision.

Evaluate in minutes

Download a pre-packaged image for VMware Workstation and Oracle VirtualBox, VMware ESXi and vSphere, or Microsoft Hyper-V, and have Nagios XI running without touching a package manager.

Deploy to production

Install directly onto a clean Linux server, on your own hardware or in your own cloud account, with full control of the system underneath it.

Offline and air-gapped

Offline installation is supported on Red Hat and CentOS Stream, as a direct install rather than a virtual machine image. Dependencies ship inside the installer, so there are no local repository mirrors to stand up first.

Access and authentication

Authenticate against Active Directory or LDAP over SSL, or set up Single Sign-On with Microsoft Entra ID, with two-factor through Duo. Users see only the Host and Service groups you grant them, so one installation serves several teams without any of them seeing the others.

Nagios xi Pricing

Nagios XI pricing, per Node and perpetual

Perpetual licensing, priced by the number of Nodes (Hosts) you monitor. Services are unlimited, so adding checks to a Host you already license costs nothing.

Standard

Infrastructure monitoring, graphing, and alerting for small to medium environments.

  • 90+ Configuration Wizards and Auto-Discovery
  • Unlimited Services on every licensed Node
  • Smart Dashboards, performance graphs, and Views
  • Open REST API and built-in automation
  • Configuration rollback and snapshots
  • SLA reports, Capacity Planning, and scheduled reports
From, 100 Nodes$2,595
2000 Nodes and aboveContact Sales
Get Started Free

Sitewide

Multiple unlimited-Node installations for large or distributed environments running XI at more than one site.

  • Multiple instances of unlimited-Node Nagios XI
  • Enterprise Edition features included
  • A Nagios Fusion licence included
  • Site-to-site connection for distributed deployments
  • Substantial discount against per-instance pricing
Multiple unlimited NodesContact Sales
Talk to Sales
Nodes (Hosts) Standard Enterprise
100$2,595$4,690
200$4,395$6,490
300$6,195$8,290
400$7,295$9,390
500$8,295$10,390
750$11,495$13,590
1000$14,995$17,090
2000 and aboveContact Sales

Not sure how many Nodes you need? Use the XI Plan Calculator, or see all Nagios pricing plans.

Licensed onNodes, also called Hosts. A Node is any unique IP address or Fully Qualified Domain Name you monitor: a server, switch, router, firewall, workstation, or appliance.
ServicesUnlimited. Paid licenses place no limit on the number of Services you run against the Nodes you licensed.
License termPerpetual. The license is yours permanently, and the Standard Edition keeps running whether or not Maintenance & Support is renewed.
Installations per keyThree. One production install, one test or lab install, and one disaster recovery install that stays non-operational until it takes over or is monitoring the production instance.
First year includedVersion upgrades, up to ten support cases, access to the Nagios Support Portal, Premium features, and an assigned Customer Success Manager. Renewing your Maintenance & Support plan keeps all of it active.
Enterprise EditionAn add-on to any license level, and included with every Sitewide package.
Questions[email protected], 1-888-624-4671 in the United States, or +1 651-204-9102 internationally.

Running A Lab, Or Learning Nagios XI?

Seven Nodes or 100 Services, whichever comes first, with most Standard Edition features. Self-supported.

Get Started Free

No credit card required

In Producgtion

Nagios XI in production, from one-person teams to 2,500 Nodes

I love the stats and graphs Nagios XI gives me. I can give that to my leadership team to prove how the network is performing and what's proactively being done. Considering the time that Nagios XI saves me personally, the cost is a no-brainer.

IT Director
North American logistics services provider
Regional internet provider
8,800 Services checked

Watch Communications

A wireless provider covering rural Indiana, Ohio, and Illinois needed checks its previous system could not perform without a quote for every custom one. Nagios XI now watches every point of presence, and the checks nobody else would write get written in-house.

  • 2,500 devices
  • 475 sites
  • 2-min avg interval
Read the case study
Financial markets
300 Nodes monitored

Amman Stock Exchange

Jordan's national exchange runs its trading infrastructure on a single Nagios XI deployment, and grew it from 200 Nodes to 300 without changing the architecture underneath it.

  • Over 4,000 Services
  • Scaled from 200 Nodes
  • Single deployment
Read the case study
Logistics
1 person running it

A North American logistics provider

One IT director serves 300 employees across 13 work sites and every subsidiary in the group. Configuration Wizards, dashboards, and scheduled reporting are what make that ratio survivable rather than heroic.

  • 50 servers
  • 430+ Services
  • 13 work sites
Read the case study
Frequently Asked Questions

Nagios XI FAQ

What is Nagios XI?

Nagios XI is commercial IT infrastructure monitoring software that runs on a Linux server you own. It executes checks against your servers, network devices, applications, and services on the interval you set, compares each result against the thresholds you defined, records the outcome, and notifies the people you assigned. It is built on the Nagios Core monitoring engine and adds a web interface, Configuration Wizards, a database, reporting, dashboards, and a REST API.

Is there a free version of Nagios XI?

Yes. The free license monitors 7 Nodes or 100 Services, whichever is reached first, and includes most Standard Edition features. It is self-supported. Students may qualify for higher limits depending on their needs and qualifications. Nagios Core is also free and open source, with no Node or Service limit at all.

What is the difference between Nagios Core and Nagios XI?

Nagios Core is the free, open source monitoring engine, configured by editing text files. Nagios XI is built on that engine and adds web-based configuration, 70+ Configuration Wizards, Auto-Discovery, a backing database, dashboards, performance graphing, reporting, multi-tenancy, a REST API, and a support contract. An existing Core configuration can be migrated into XI. See Nagios Core vs Nagios XI for a fuller comparison.

How is Nagios XI licensed?

Licensing is perpetual and priced by the number of Nodes (Hosts) you monitor. A Node is any unique IP address or fully qualified domain name. There is no limit on the number of Services you run against those Nodes, so adding more checks to a Host you already licensed costs nothing. The first year of Maintenance & Support is included with the purchase.

What is the difference between the Standard and Enterprise Editions?

The Standard Edition covers monitoring, configuration, dashboards, graphing, and core reporting. The Enterprise Edition adds Capacity Planning, Service-Level Agreement reports, scheduled reports and scheduled pages, Advanced Business Process Monitoring, the SNMP Trap Interface, bulk modification and renaming tools, the Audit Log, and Deadpool settings. Enterprise is an add-on to any license level. Compare the editions feature by feature.

What are Premium features in Nagios XI?

Premium features require active Maintenance & Support benefits. They include Single Sign-On, the Nagios Mod-Gearman user interface, and a set of premium Configuration Wizards. Access comes with the first year of your license and continues as long as your plan is renewed. See Premium features for the full list.

How long is the Nagios XI free trial?

Thirty days, with the full Enterprise Edition feature set and no credit card. License activation is not required during the trial period. Learn more about the free trial.

How many installations does one Nagios XI license key allow?

Three, each with a defined purpose. One production install that monitors your environment. One test or lab install for previewing upgrades and configuration changes, which is not to be used for production monitoring or notifications. And one disaster recovery install that stays non-operational unless it is monitoring the production XI instance or has taken over from it. An active-active pair needs a license for each system.

What does a Nagios XI purchase include?

A perpetual license plus the first year of Maintenance & Support benefits: version upgrades for that year, up to ten support cases, access to the Nagios Support Portal, Premium features, and an assigned Customer Success Manager. Optional phone support contracts are available. See Maintenance & Support plan options.

What happens when Maintenance & Support expires?

The Standard Edition keeps running and keeps monitoring, and anything already configured stays in place. What you lose is the ability to change it: premium Configuration Wizards cannot be run again, version upgrades and server migration are unavailable, and expedited support channels close. Renewing restores access.

Which operating systems does Nagios XI run on?

Nagios XI installs on 64-bit Linux. Supported distributions change with each release, so check the Nagios software and operating system compatibility matrix for the versions supported by the release you are installing. Red Hat and Oracle Linux additionally require CodeReady Builder to be enabled and a valid Red Hat subscription through Red Hat Subscription Management.

What is the latest version of Nagios XI?

Nagios XI 2026R1.7, released 4 August 2026. Every release, including what changed and what was removed, is listed on the Nagios XI changelog.

Does Nagios XI require an agent?

No. Agentless monitoring over SNMP, WMI, WinRM, and SSH covers network devices, appliances, and servers where nothing can be installed. Agents are an option rather than a requirement: NCPA runs on Linux, Windows, macOS, and AIX, and XI also works with NRPE and NSClient++ where those are already deployed. Most environments end up using a mix.

Can Nagios XI monitor Windows servers?

Yes, four ways: the NCPA agent, NSClient++, WMI, or WinRM. Services, event logs, performance counters, disk usage, scheduled tasks, and Windows Updates all have Configuration Wizards. Windows event logs can also be forwarded to Nagios Log Server when you need to search their contents rather than alert on their state.

Can I use my own plugins and community add-ons?

Yes. Because Nagios XI uses Nagios Core as its monitoring engine, custom plugins, event handlers, and community add-ons work with it. A plugin is any executable that returns an exit code and, optionally, performance data, so you can write one in whatever language suits the check. The Generic Plugin Wizard brings a custom plugin into the interface alongside the shipped Wizards. Community plugins are installed separately and maintained by their authors.

Can Nagios XI be installed offline or in an air-gapped network?

Yes, on Red Hat and CentOS Stream. From version 2024R1.3.2 onward the operating system dependencies are packaged inside the installer, so local repository mirrors are not required. An offline instance cannot upgrade through the web interface or check for new versions, and license renewals are applied manually, so upgrades use the offline tar file for the target version. Choose the offline method at install time if the server will stay offline.

Get Started

Buy it once, run it on hardware you own, monitor as much as you like

Join thousands of teams who’ve eliminated downtime and reduced costs with Nagios XI.

No credit card required. Licensing questions to [email protected].