Whether you have new monitoring software to get up and running or you simply want to maximize the monitoring solution you currently have, there are several IT infrastructure monitoring best practices to keep in mind. These will not only save you time and money in the long run, but they’ll also make your daily work easier and more productive. Here are just five practices that you can start implementing in your own environment:
Yes, you really have to read the owner’s manual. Reading the manual is like flossing: It’s not fun, but it’s necessary, and eventually you’ll be glad you did it.
Thoroughly reading the documentation for your IT monitoring software is one of the most important things you can do when installing it because it provides you with the information you need to know. By following the documentation from cover to cover, asking your vendor questions, and documenting their answers, you and your team will be able to easily find answers when questions come up in the future. Consider creating an FAQ site with all the information gathered where the team can go to find common questions and answers; this will also help with onboarding future team members more quickly.
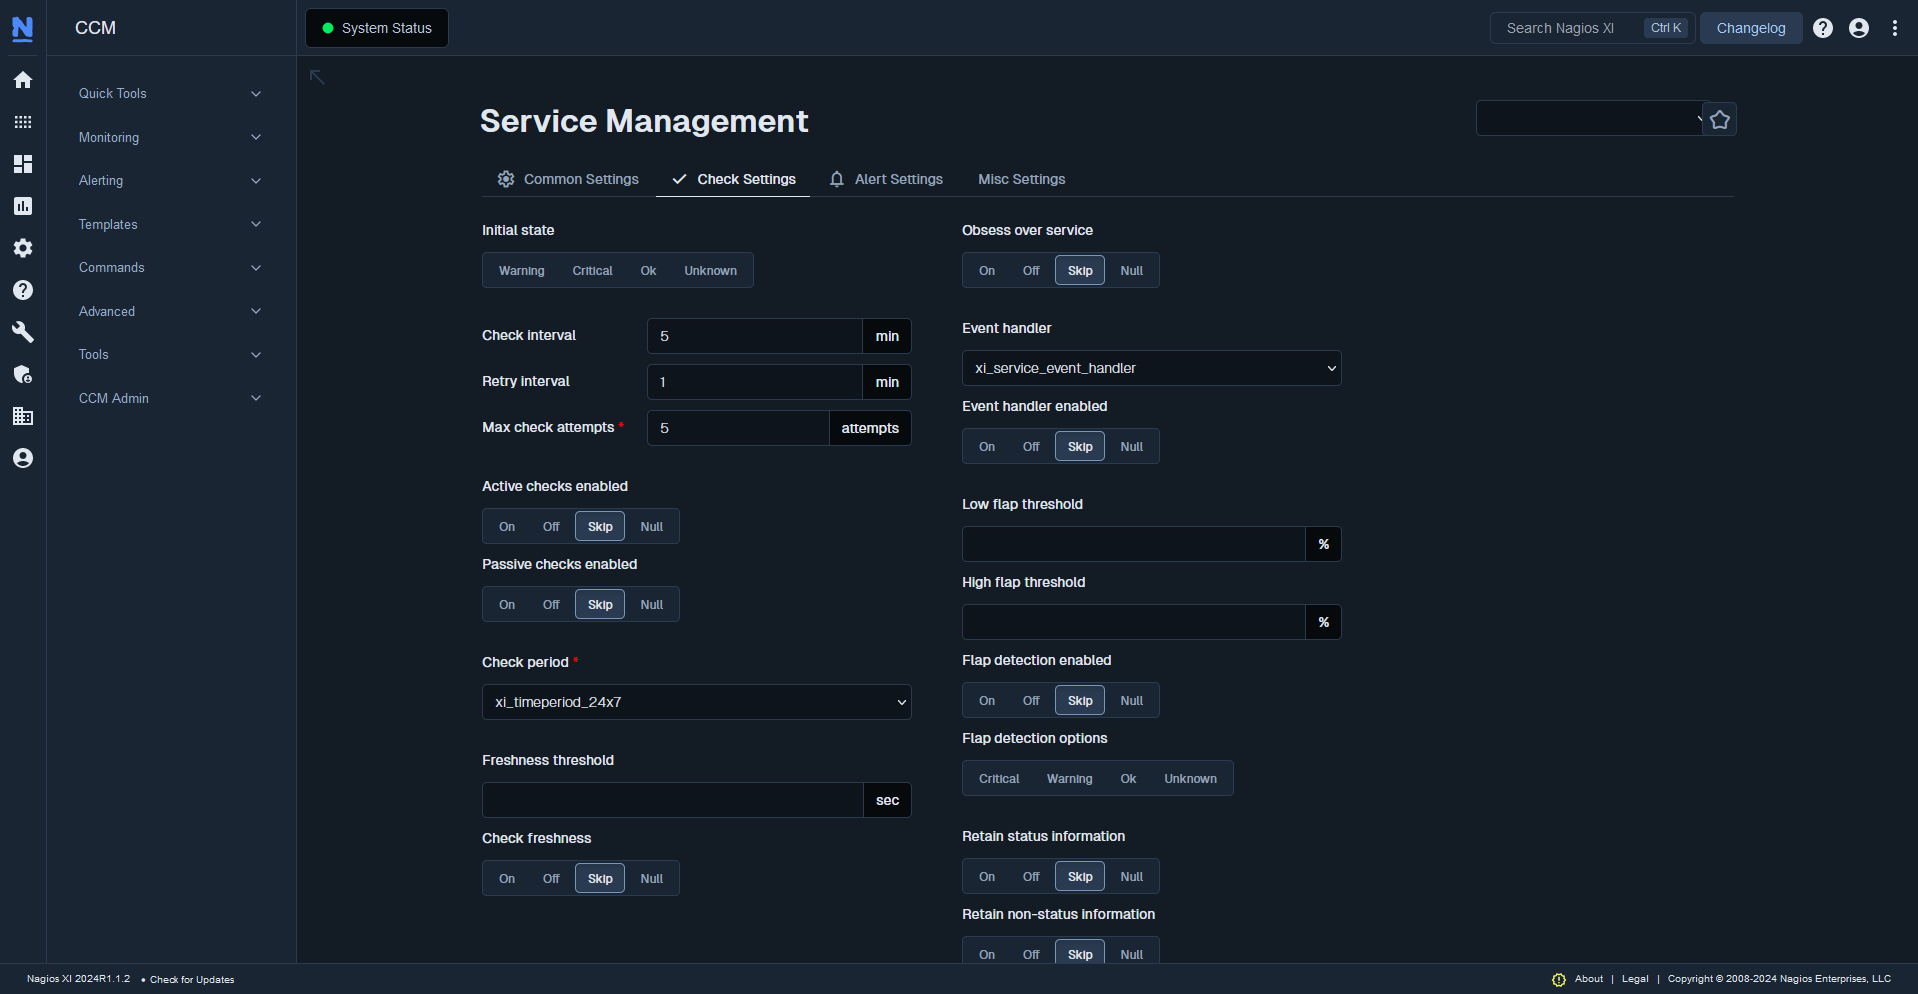
IT monitoring software doesn’t always just monitor if there’s a problem; some monitoring solutions will also resolve the issue for you. If your monitoring solution has this capability, take the time to create a script or command that can automatically respond when a device isn’t working properly. This IT infrastructure monitoring best practice saves administrators from needing to get involved in each little anomaly.

One of the most common uses for automation is to perform a restart command. If your system is unable to do that, consider using an IT monitoring system that can enter data directly into your integrated ticketing system. By creating a ticket and then marking the issue as resolved within the ticketing system, the monitoring tool automates more of an administrator’s work to drive greater efficiency and productivity.
Increase the clarity and efficiency of your IT infrastructure monitoring to proactively resolve issues.

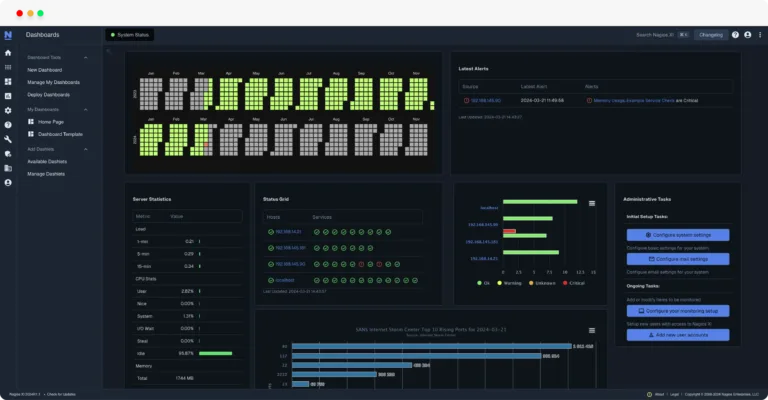
An increasing number of organizations want and need to monitor more than the typical switches, routers, servers, websites, workstations, and other devices. As more devices connect to the internet—everything from refrigerators to crop soils—the value of your IT monitoring software grows as you monitor more because it gives you a clearer vision of your organization’s infrastructure. This comprehensive view can extend even further when your monitoring solution has an extensible architecture, like Nagios XI, that allows you to utilize plugins for monitoring beyond what you initially thought possible.
Let’s say that your monitoring software is tracking a server in the basement of your building. This is helpful for monitoring what the server is doing, but what if you also monitored the temperature sensor that lives on the server rack? Now, you can monitor what the server is doing and what might be happening to it. If you get an alert that the CPU is running high, you can check the temperature sensor to see if there’s a correlation.
Many organizations initially focus on only monitoring the basics, but by thinking about the big picture, however—from the lights in the building to the office refrigerator—system administrators boost the power and immense value of their monitoring software to better understand the “why” behind the “what” of their infrastructure.
Another best practice is to customize alerts to meet the needs of your organization. Some organizations want to set up alerts for everything, or they simply use their software’s default settings to alert on everything. Both practices, however, cause alert fatigue. This condition occurs when administrators and users are bombarded with so many alerts that they don’t escalate or act upon them anymore. The result is that actual, important alerts are ignored or missed.

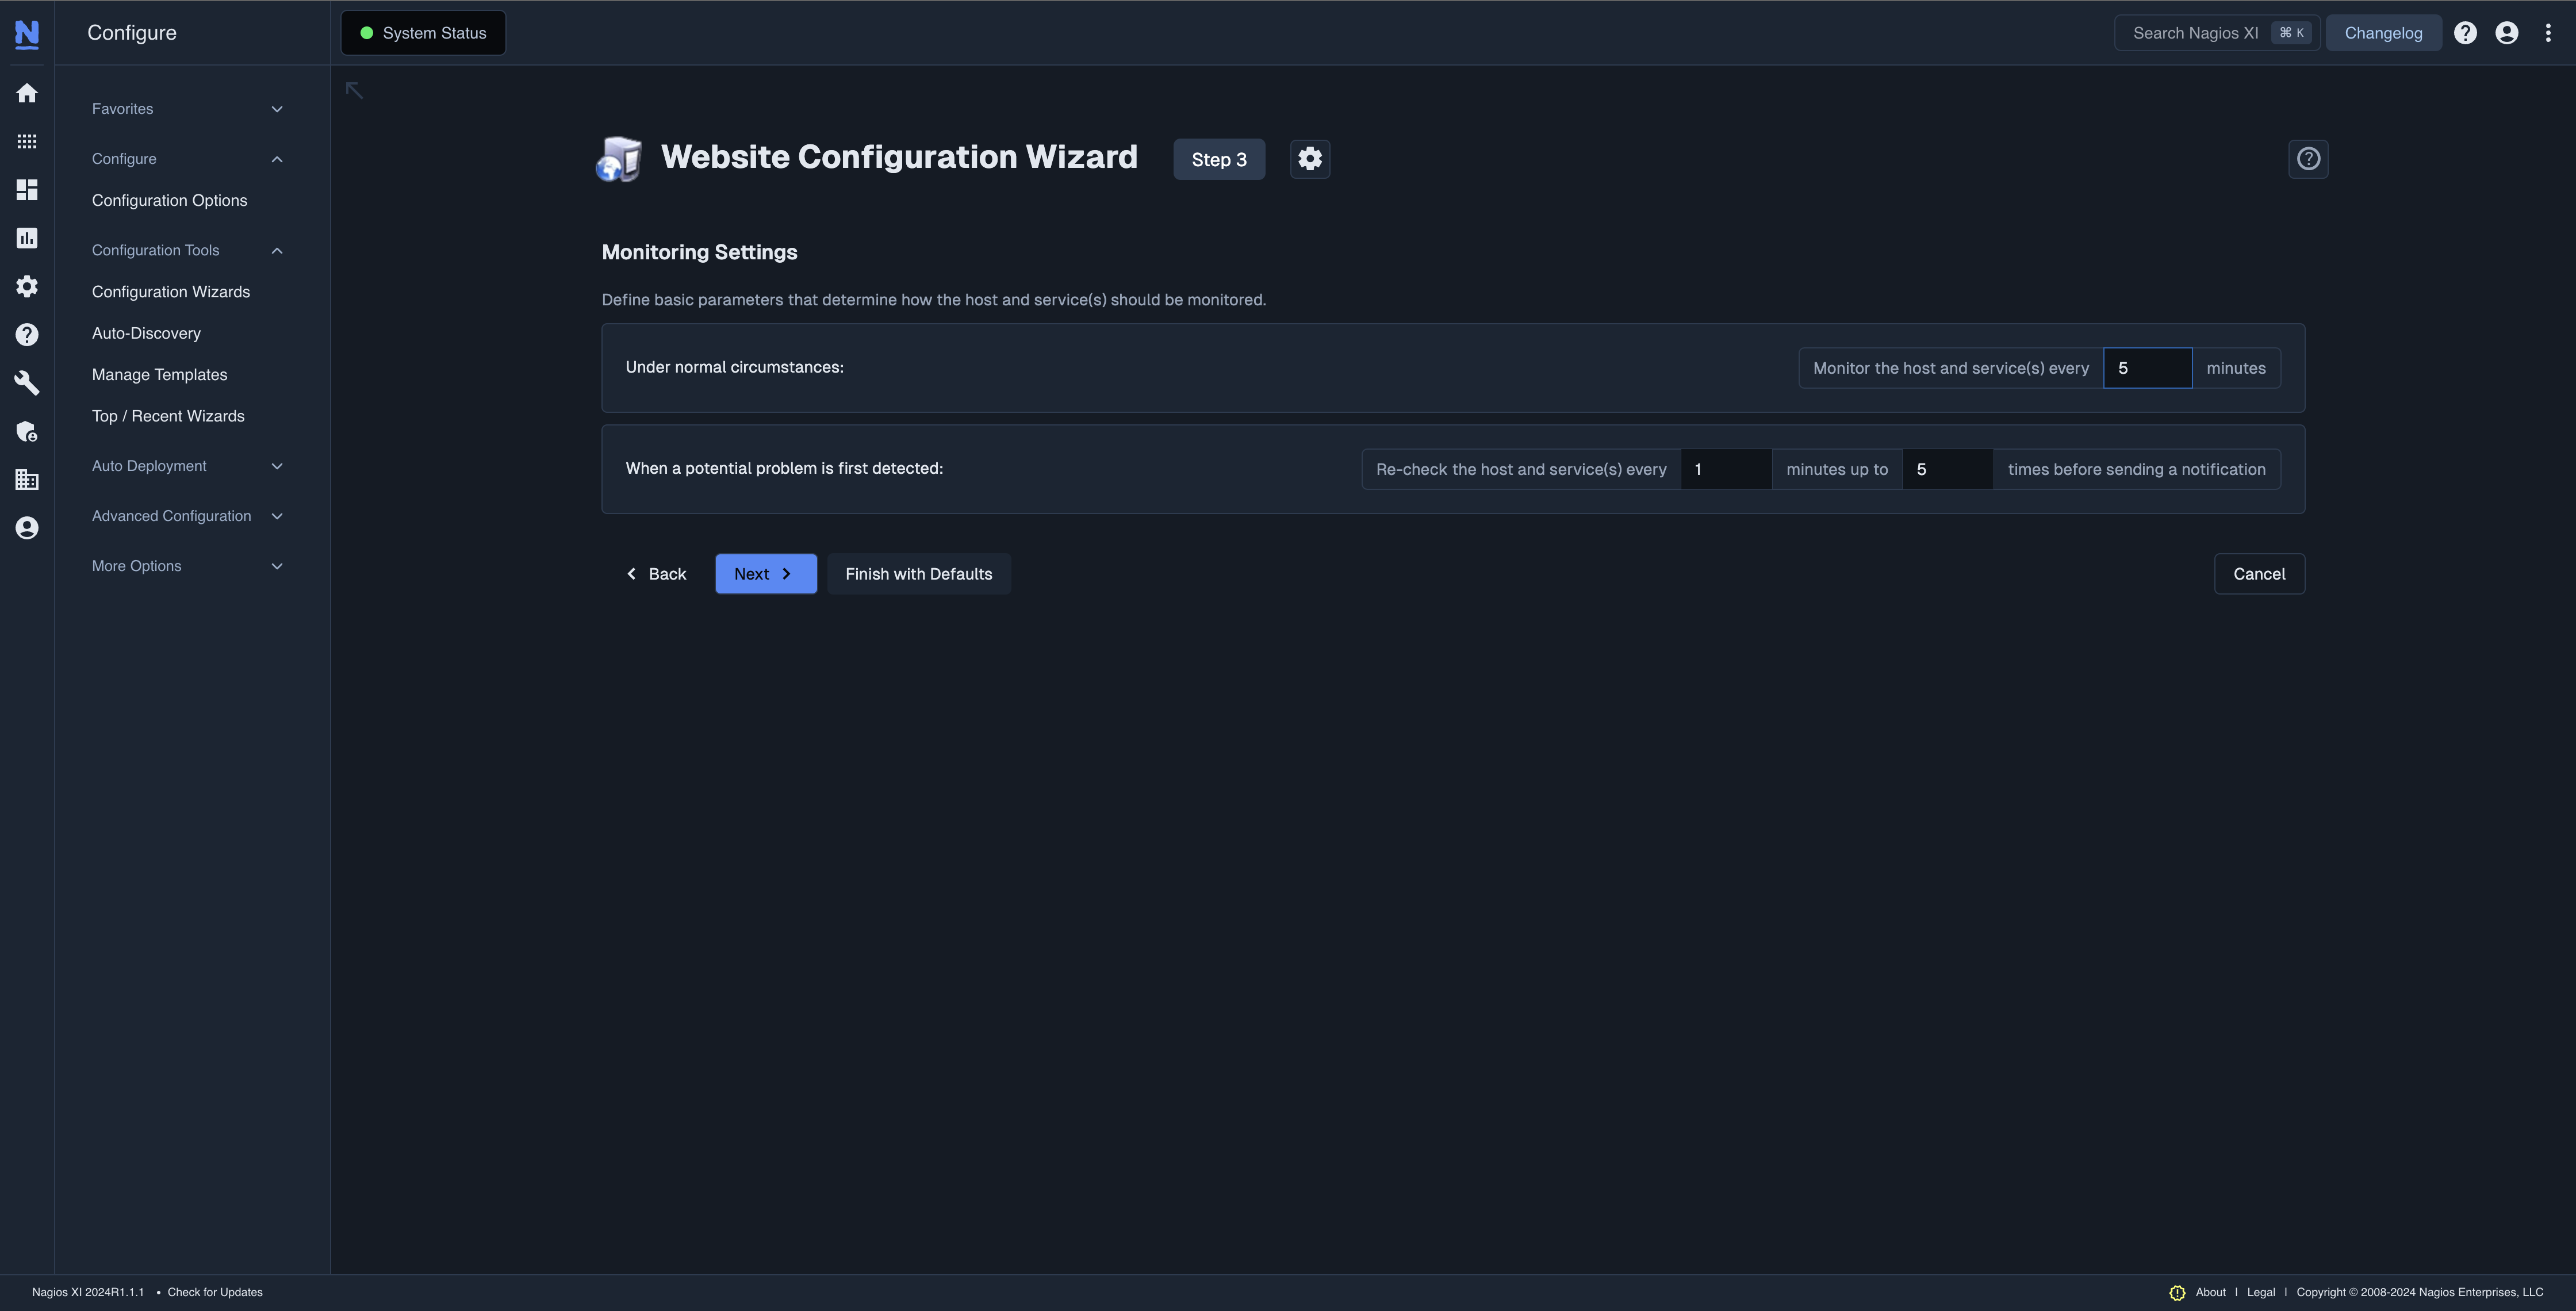
To prevent this from happening, let your IT infrastructure monitoring vendor guide you through setting up notification thresholds and recheck intervals that make sense for your organization and priorities. When a threshold is reached, your IT monitoring software can run a recheck interval where it rechecks the Host or Service a chosen number of times over a specified amount of time to make sure that exceeding the threshold wasn’t just a blip. In other words, the software will first verify that it’s a recurring problem worthy of an alert, instead of sending you a notification for a problem that turns out to be nothing.
For example, let’s say an employee launches a video conferencing tool on their desktop, and the CPU spikes over the predetermined threshold. After detecting the spike, the IT monitoring software will check that desktop every few minutes and see that the spike has worked itself out. No alert needs to be sent. On the other hand, if this spike happened and it didn’t resolve itself after the recheck interval had passed, the monitoring software would send an alert. With these thresholds and intervals in place, the monitoring solution will therefore only send alerts when necessary, which allows you to focus on resolving real problems.
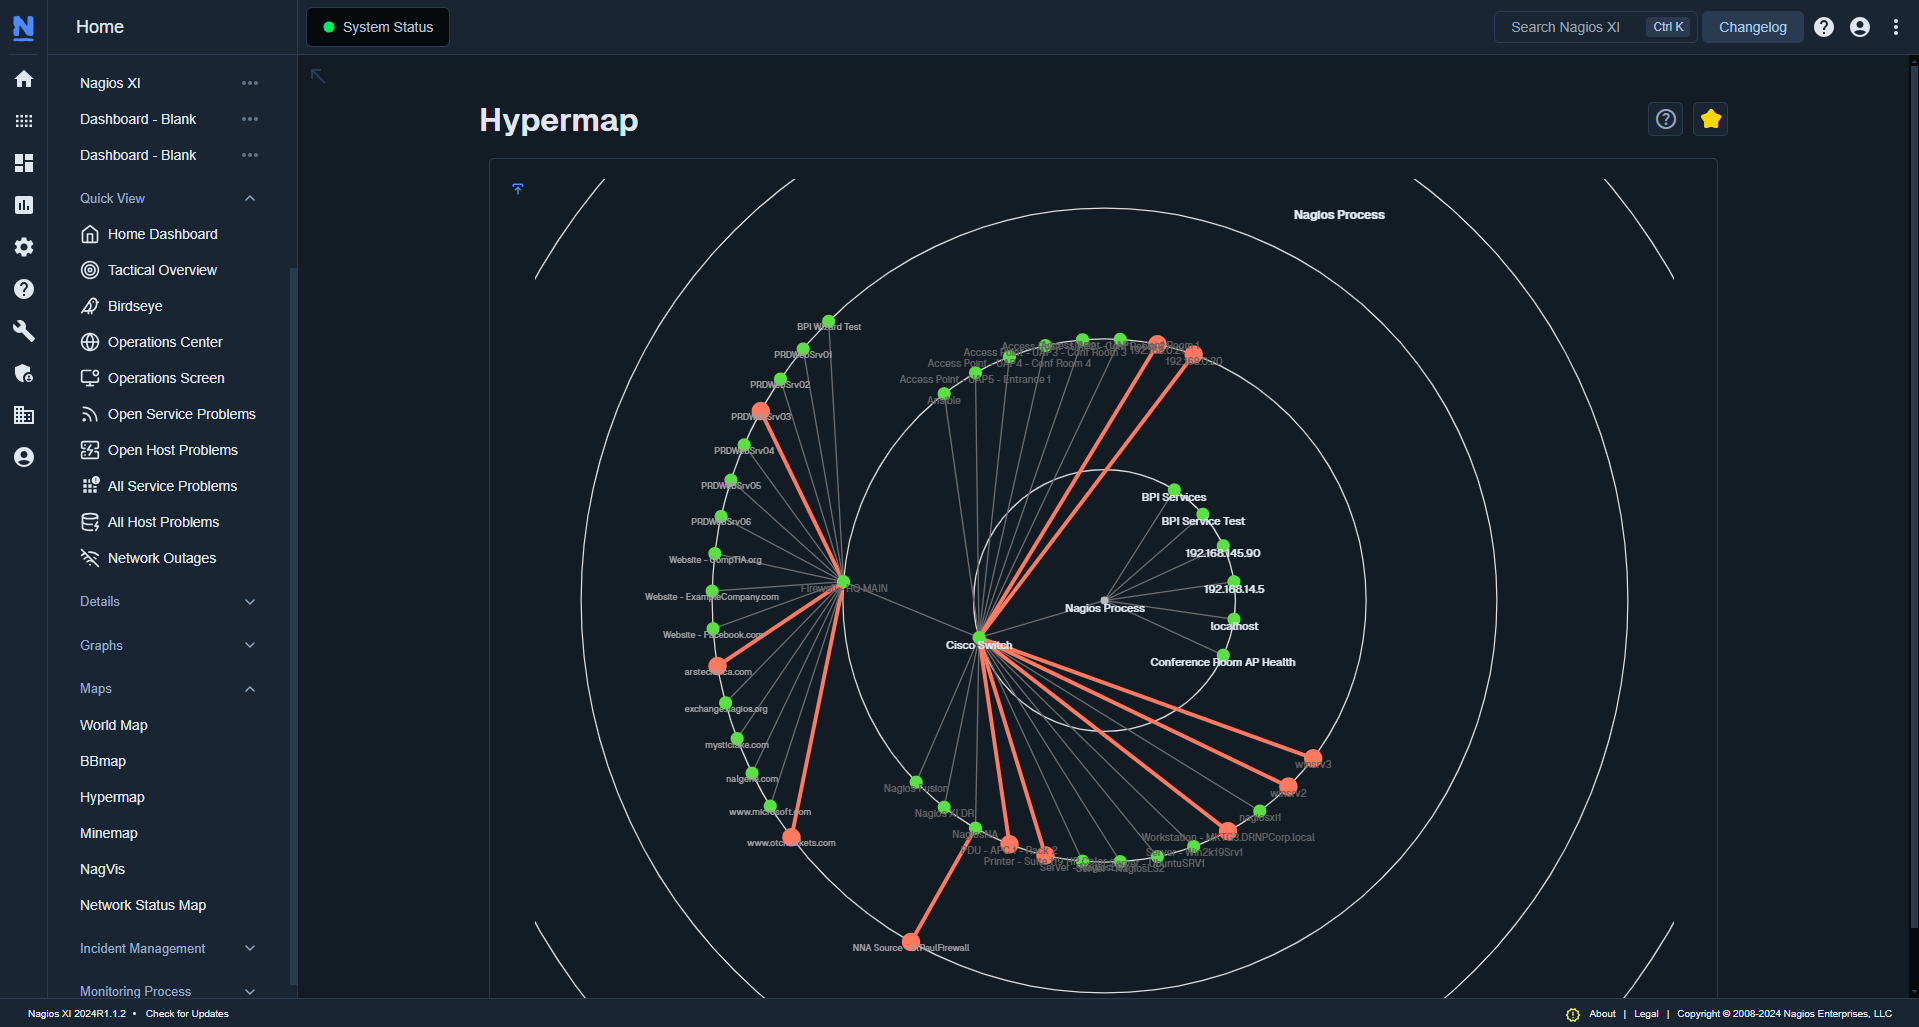
Another best practice that allows you to minimize the number of unnecessary notifications is defining parent-child Host relationships in your IT monitoring software. These relationships help the software determine the reachability of Hosts so that it can work more intelligently and make your life easier. Rather than giving your software 10,000 things to monitor individually, you can define the parent and child Hosts so that the software recognizes that a particular server lives beyond a particular network device. As a result, you know that if the child Hosts are unreachable, it’s more than likely because the parent Host is down. By outlining how everything interacts, you can cut down on the number of alerts and better understand where and what the problem is if something goes wrong.

For example, if you get an alert that the firewall is down and you can’t reach the server beyond it, you don’t have to waste time figuring out if something is wrong with the server; you can immediately identify that the downed firewall is causing the issue since it’s the parent Host.
By configuring a parent-child relationship, you can avoid alert fatigue and more accurately identify and respond to the issues that truly require your attention.
To learn more on this topic, check out our video on parent-child host relationships in XI.
IT monitoring is an essential practice for keeping your business on track, but if you aren’t taking the time to customize it to the needs of your organization, you won’t get as much return on your software investment. If you want to get more out of your investment, implementing additional best practices like utilizing automation, monitoring more than just basic devices, and setting up parent-child relationships are just a few of the ways you can optimize your IT monitoring software. By incorporating at least some of these practices into your IT monitoring, you will be better positioned to save time and resolve issues before they have a chance to affect your network.
To see how you can implement these best practices in your own IT monitoring and make your job easier, download a free trial of Nagios XI today.
Nagios, the Nagios logo, and Nagios graphics are the servicemarks, trademarks, or registered trademarks owned by Nagios Enterprises. All other servicemarks and trademarks are the property of their respective owner. Website Copyright © 2009-2025 Nagios Enterprises, LLC. All rights reserved.