For many organizations, Nagios Core solves significant challenges, such as monitoring systems and alerting administrators when something goes wrong. However, it takes a significant amount of time and deep expertise in coding to configure and manage, especially as the company grows.
This need for deep expertise is why we created Nagios XI, a user-friendly IT infrastructure monitoring software that not only alerts system administrators when something goes wrong but also makes network monitoring and reporting accessible to non-technical users. This added accessibility, which is not available with the open-source platform, saves organizations a significant amount of time. It also frees up the system administrator’s time for other tasks that require their deep technical expertise.
To give you a better idea of how this enterprise-level monitoring solution can improve the efficiency of your operations, we’ve outlined seven ways XI can save you valuable time.
Core users need to understand the command line (the matrix or code that runs the solution) for configuration, monitoring, and reporting. The command line requires the expertise of a highly technical and often expensive internal resource, most commonly a system administrator. As a result, Core not only calls for a high level of expertise, but it also demands an extensive amount of time to manage.
XI, on the other hand, does not require this expertise. This solution was built to alleviate the amount of time system administrators need to manage repetitive day-to-day server and network monitoring tasks and empower non-technical users to manage it. XI’s user-friendly interface enables system administrators to quickly train new, non-technical users on how to use it without requiring them to know the command line. By training new users on XI, a system administrator can spend more of their time on tasks that need their technical expertise.

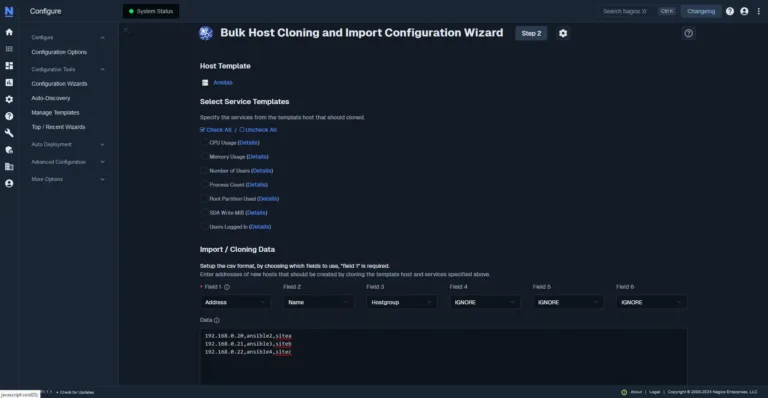
With over 70 Configuration Wizards, XI reduces the amount of time and complexity it takes to configure new devices for monitoring. These Configuration Wizards make it easy for users to monitor new devices, servers, and applications by walking them step by step through the monitoring configurations without requiring them to understand XI’s command-line code.
Once the devices are set up for monitoring, you can use templates to indicate things like how frequently checks run on the device, how often it re-checks after it identifies an issue, and which users or groups of users need to be alerted. Wizards, combined with templates, are a powerful way to enable seamless configuration and setup.
One popular Wizard, the Bulk Host Cloning and Import Wizard, allows you to take an example of a configured device and copy the configuration to similar devices. For example, imagine you need to monitor 2,000 new Windows workstations. Instead of configuring each workstation individually, like you would have to do in Core, you can build one configuration, save it, and use it as a template for the remaining workstations.
Similarly, if you need to make modifications, you can use the Bulk Modification Tool in the Enterprise Edition of XI to make sweeping configuration changes across thousands of Hosts or Services. Rather than changing each item individually, like in Core, you can automate the modification of many devices all at once in XI, saving a massive amount of time, especially as the organization’s infrastructure grows.
Multi-tenant user permissions eliminate the clutter admins often need to cut through, which saves valuable time. Nagios XI’s multi-tenant views and user permissions enable you to control which employees can see what within the solution. This way, employees only see what’s relevant to the devices or locations they’re monitoring. Instead of sifting through an extensive amount of information to identify what they need for their job, employees can focus on the information relevant to their roles.
To find and correlate information in Core, you need to navigate through lines of data, which consumes a lot of time. XI remedies this problem with robust built-in reports. These reports start collecting data as soon as you have devices set up for monitoring. You can easily log in to XI, run a report for the information you’re looking for, and get the data back in easy-to-digest charts and graphs, helping you quickly pinpoint the information you need.
The Enterprise Edition of XI allows you to configure automatic reports on set schedules. For example, if an executive needs a report every Monday to prepare for a weekly leadership meeting, the report can be scheduled to be sent on Mondays at a specific time in the executive’s preferred format (Excel, PDF, or PNG). Automated reports free up the user’s time, which would otherwise be spent pulling and sending the reports each week.

The reporting features within XI also help you establish a data-backed case for why new equipment or hardware is needed, potentially reducing the length of the procurement process and the number of times you need to request the required equipment.
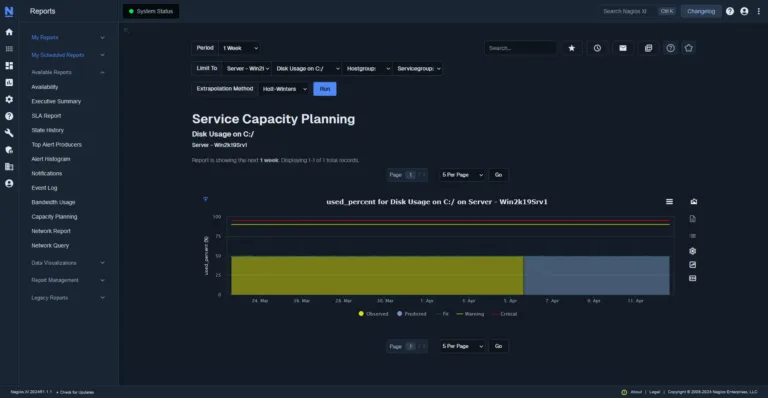
One of XI’s built-in reports in the Enterprise Edition is the Capacity Planning Report, which takes historical performance data through a number of extrapolation methods to predict when devices will hit a certain threshold. For example, you can use the Capacity Planning Report to predict when a server’s hard drive will fill up. By anticipating this, you can reduce the amount of downtime that results from devices malfunctioning when they reach critical levels.
With an easy-to-use interface, Configuration Wizards and templates, bulk modification, user permissions, and more, XI makes it easy to scale the solution as your organization grows. This ability to scale saves significant time that you would otherwise spend vetting new products to enable growth or waiting for your monitoring company to build new configurations. Instead of having to do this, you can focus on the needs of your organization while monitoring the latest and greatest technology, all within your XI solution.
One of the main ways XI can monitor the latest and greatest technology is through plugins. Since Nagios started as an open-source platform, it has a robust community of users who have built over 4,000 plugins, which are available on the Nagios Exchange. By using these plugins, organizations can monitor more than just what’s expected, such as switches, servers, and websites; they can also monitor smart devices, printers, and industry-specific products. If you can’t find a plugin for what you need, you can easily create your own Nagios Plugin using our Nagios Plugin Development Guidelines.

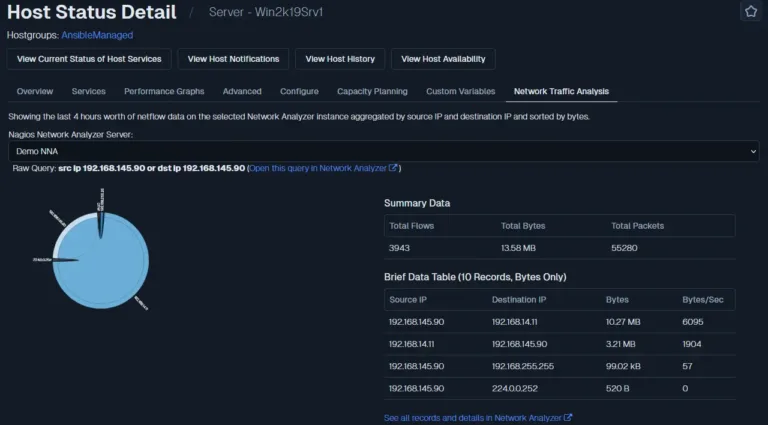
Efficiently receiving alerts is critical for minimizing the amount of time it takes to resolve any issues that arise in your IT infrastructure, which is why XI integrates seamlessly with Nagios Log Server and Nagios Network Analyzer, our solutions for log monitoring and network traffic monitoring, respectively. Like XI, you can create alerts in these two solutions if something seems out of the ordinary within the logs or network. This integration then allows you to push the alerts from these solutions into XI if something goes awry, so you have a centralized hub for checking the status of your IT infrastructure.
For example, if Log Server identifies five failed password attempts and your threshold for receiving an alert is met, this event can be pushed into XI. Rather than having to log in to separate tools to check your infrastructure status, XI can be the one place you go to monitor the things that matter the most. After all, it’s easier and takes less time to check one place instead of many, right?
Time is a valuable resource when things can go wrong in the blink of an eye and decisions need to be made quickly. To maximize your time, there are many ways XI can help you make sure you are getting the most out of it with a variety of helpful features so you can be in control of your time.
Download a free 30-day trial of Nagios XI today to experience these time-saving features for yourself.
Nagios, the Nagios logo, and Nagios graphics are the servicemarks, trademarks, or registered trademarks owned by Nagios Enterprises. All other servicemarks and trademarks are the property of their respective owner. Website Copyright © 2009-2025 Nagios Enterprises, LLC. All rights reserved.