Nagios Enterprises
For over 25 years, businesses and organizations worldwide have trusted Nagios to monitor their mission-critical IT infrastructure, catching and resolving issues before they impact operations.
Nagios XI
Enterprise-Grade Network Monitoring Software
Empower your team with proactive detection and notifications. Nagios XI provides deep, full-stack visibility across your servers, applications, and critical services. Get started free today!





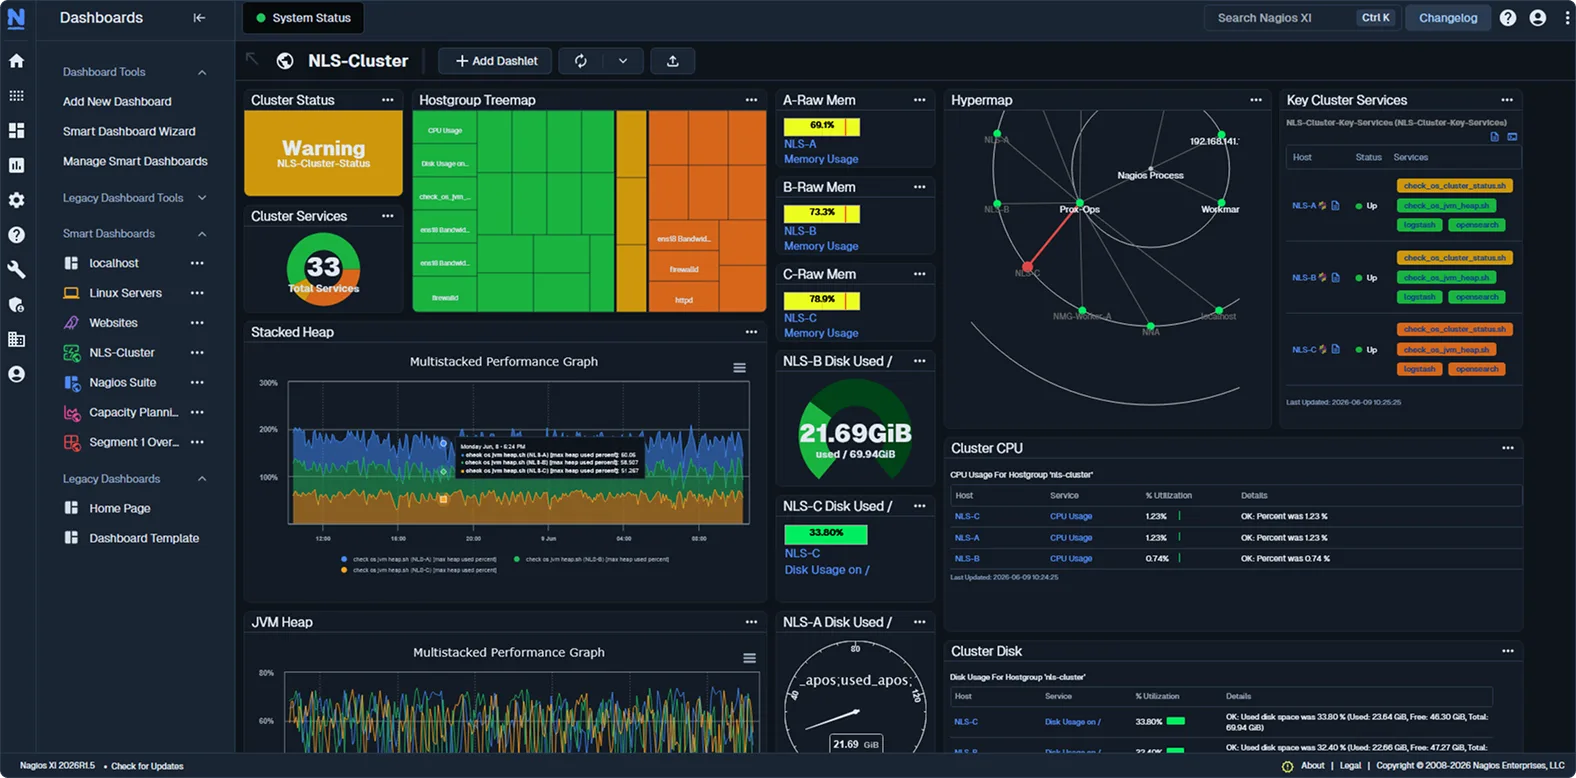
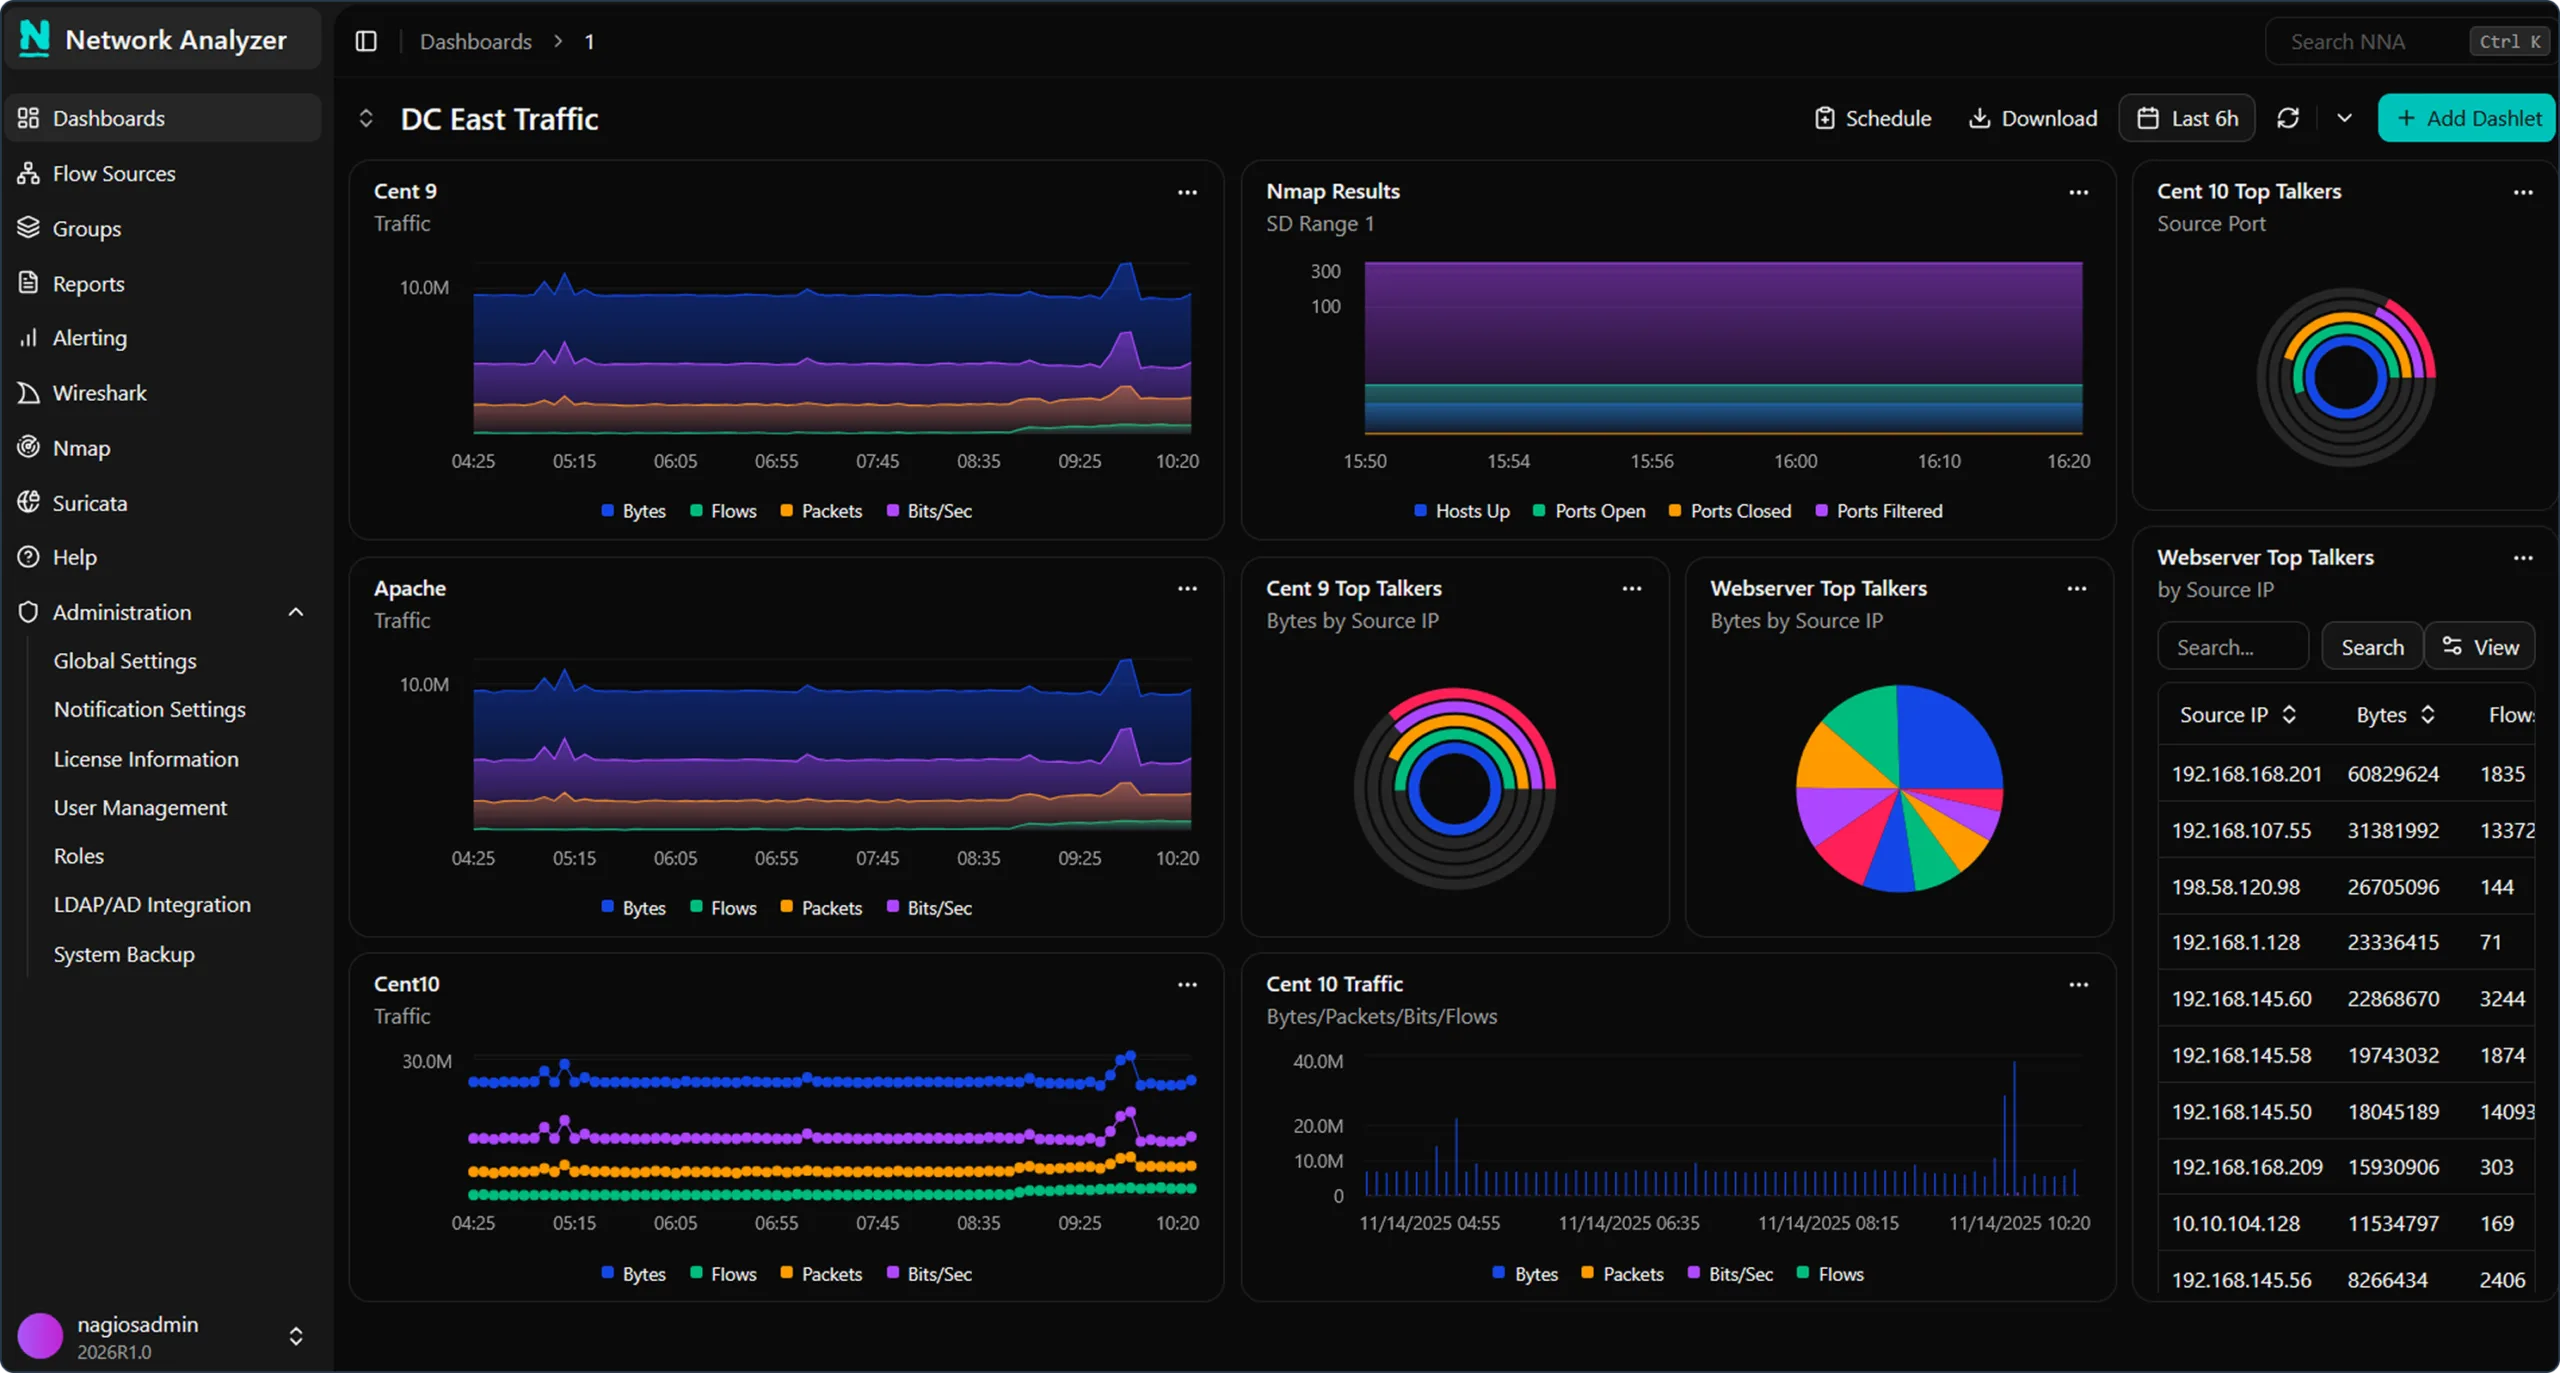
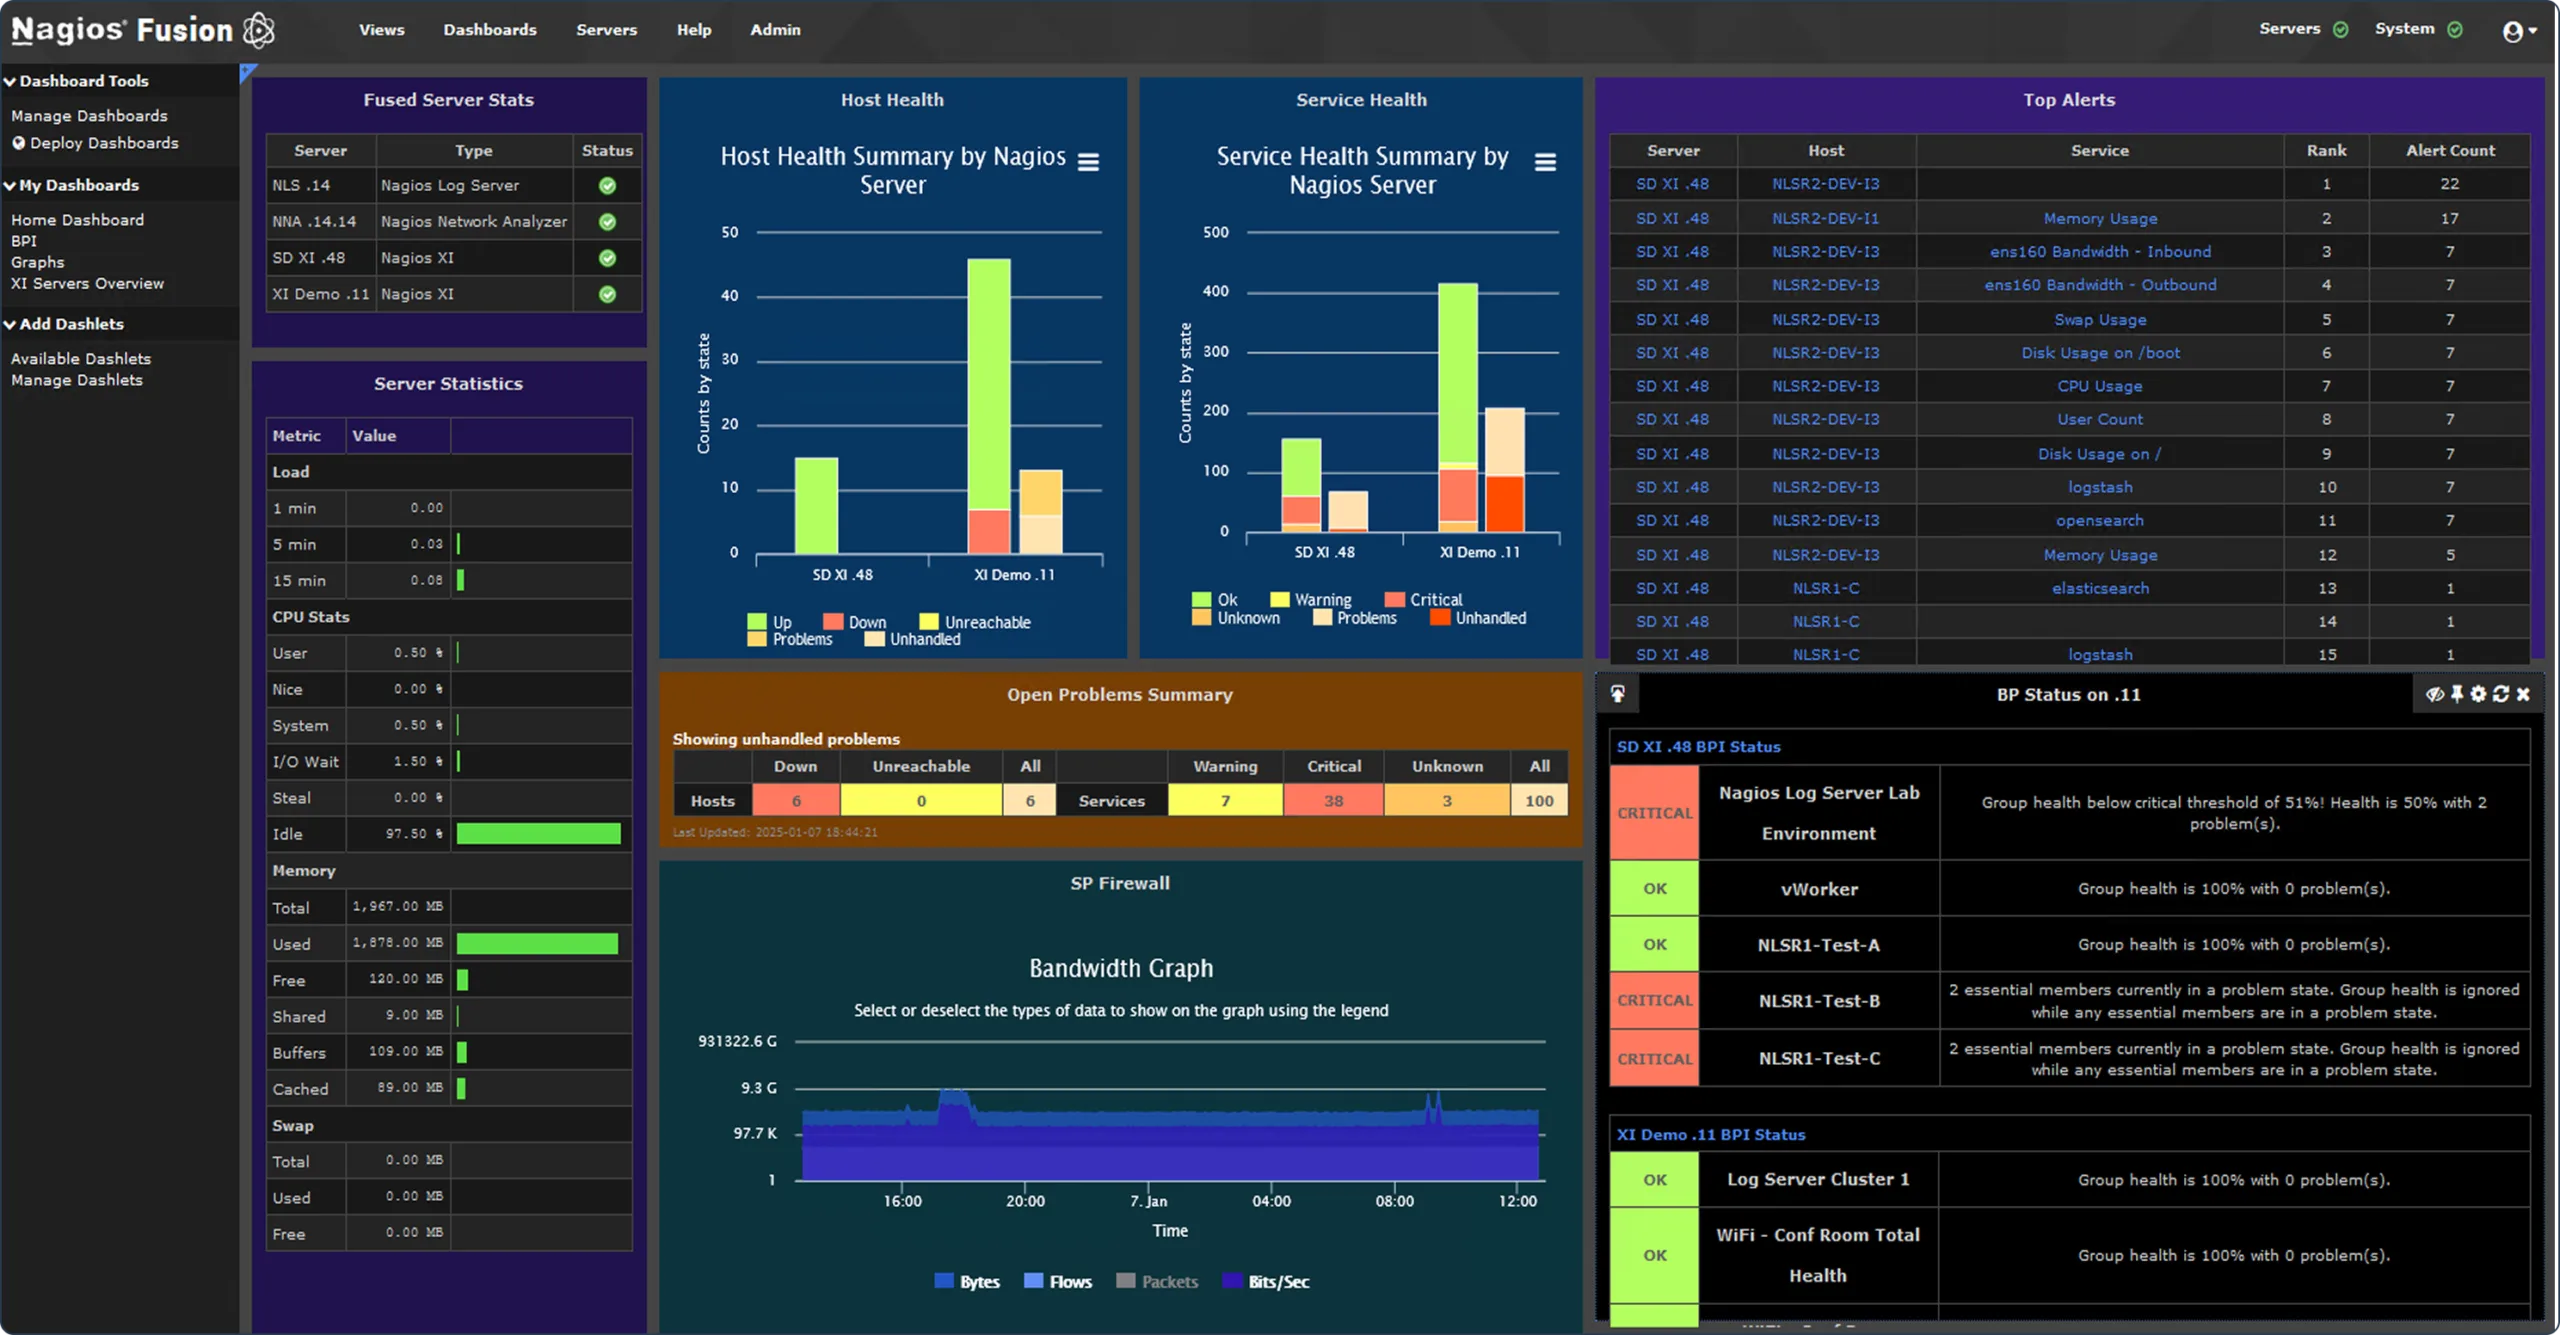
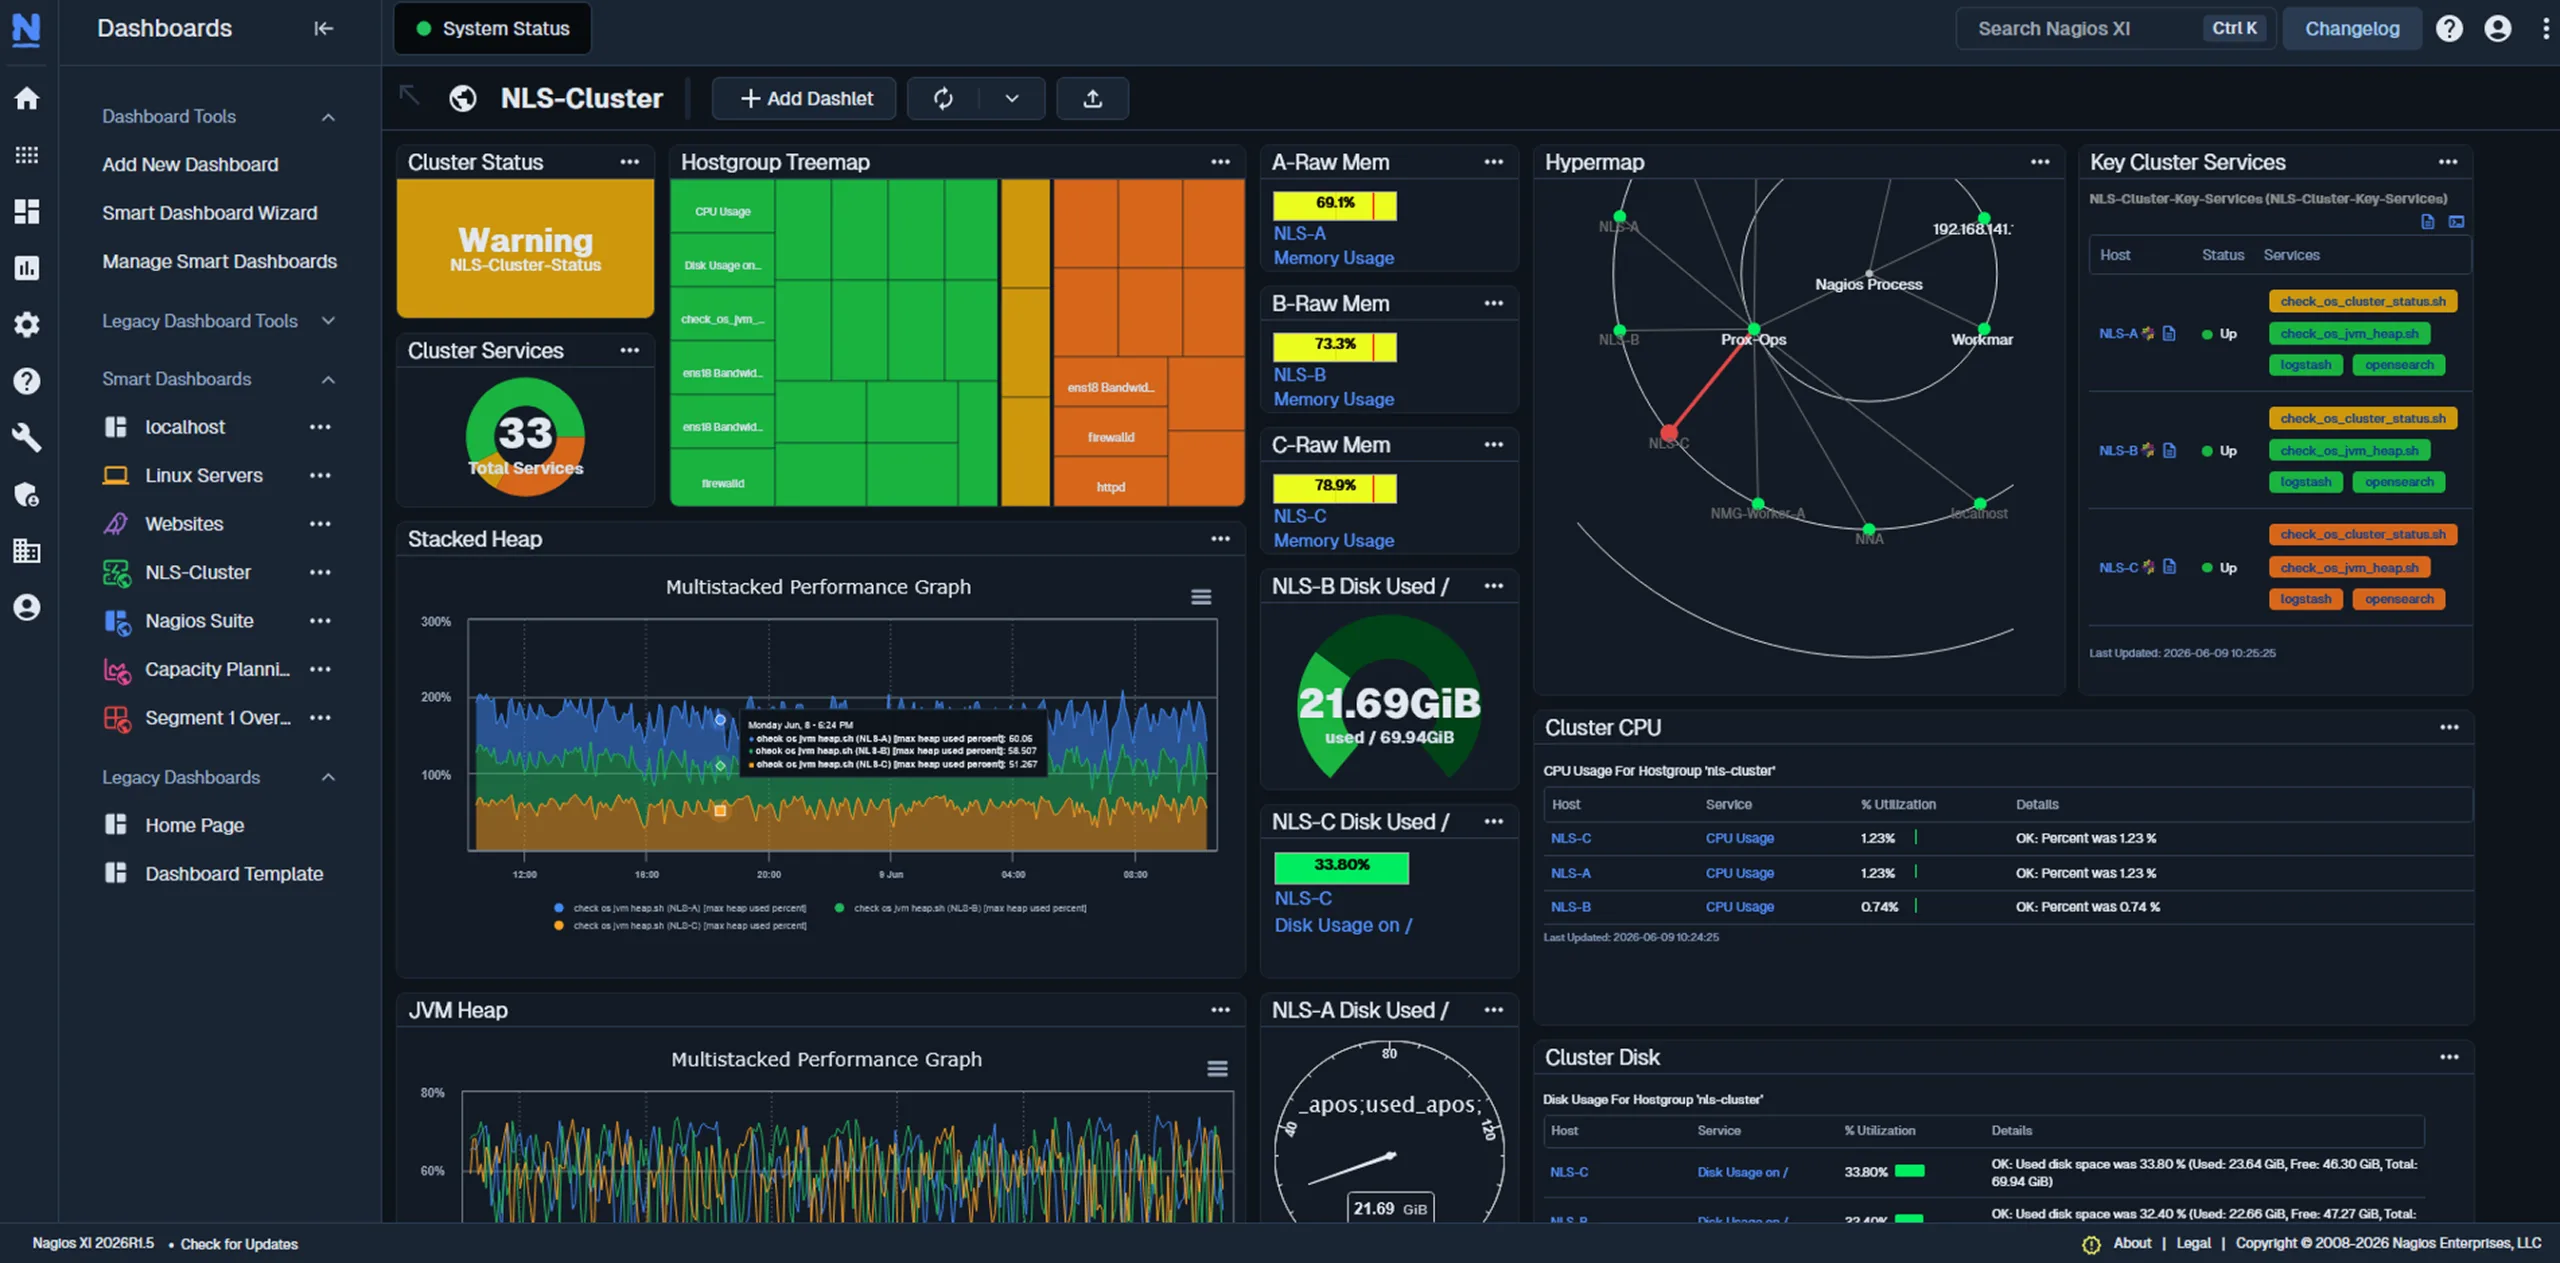
The Nagios Security Toolkit is the visibility layer underneath your security stack. It captures the infrastructure telemetry SIEMs require: device state changes, raw flow records, and retained syslog.
Explore the Security Toolkit
Auto-discovery scans surfaces hosts nobody approved, and alerts fire the moment a device's state changes without a corresponding change request.
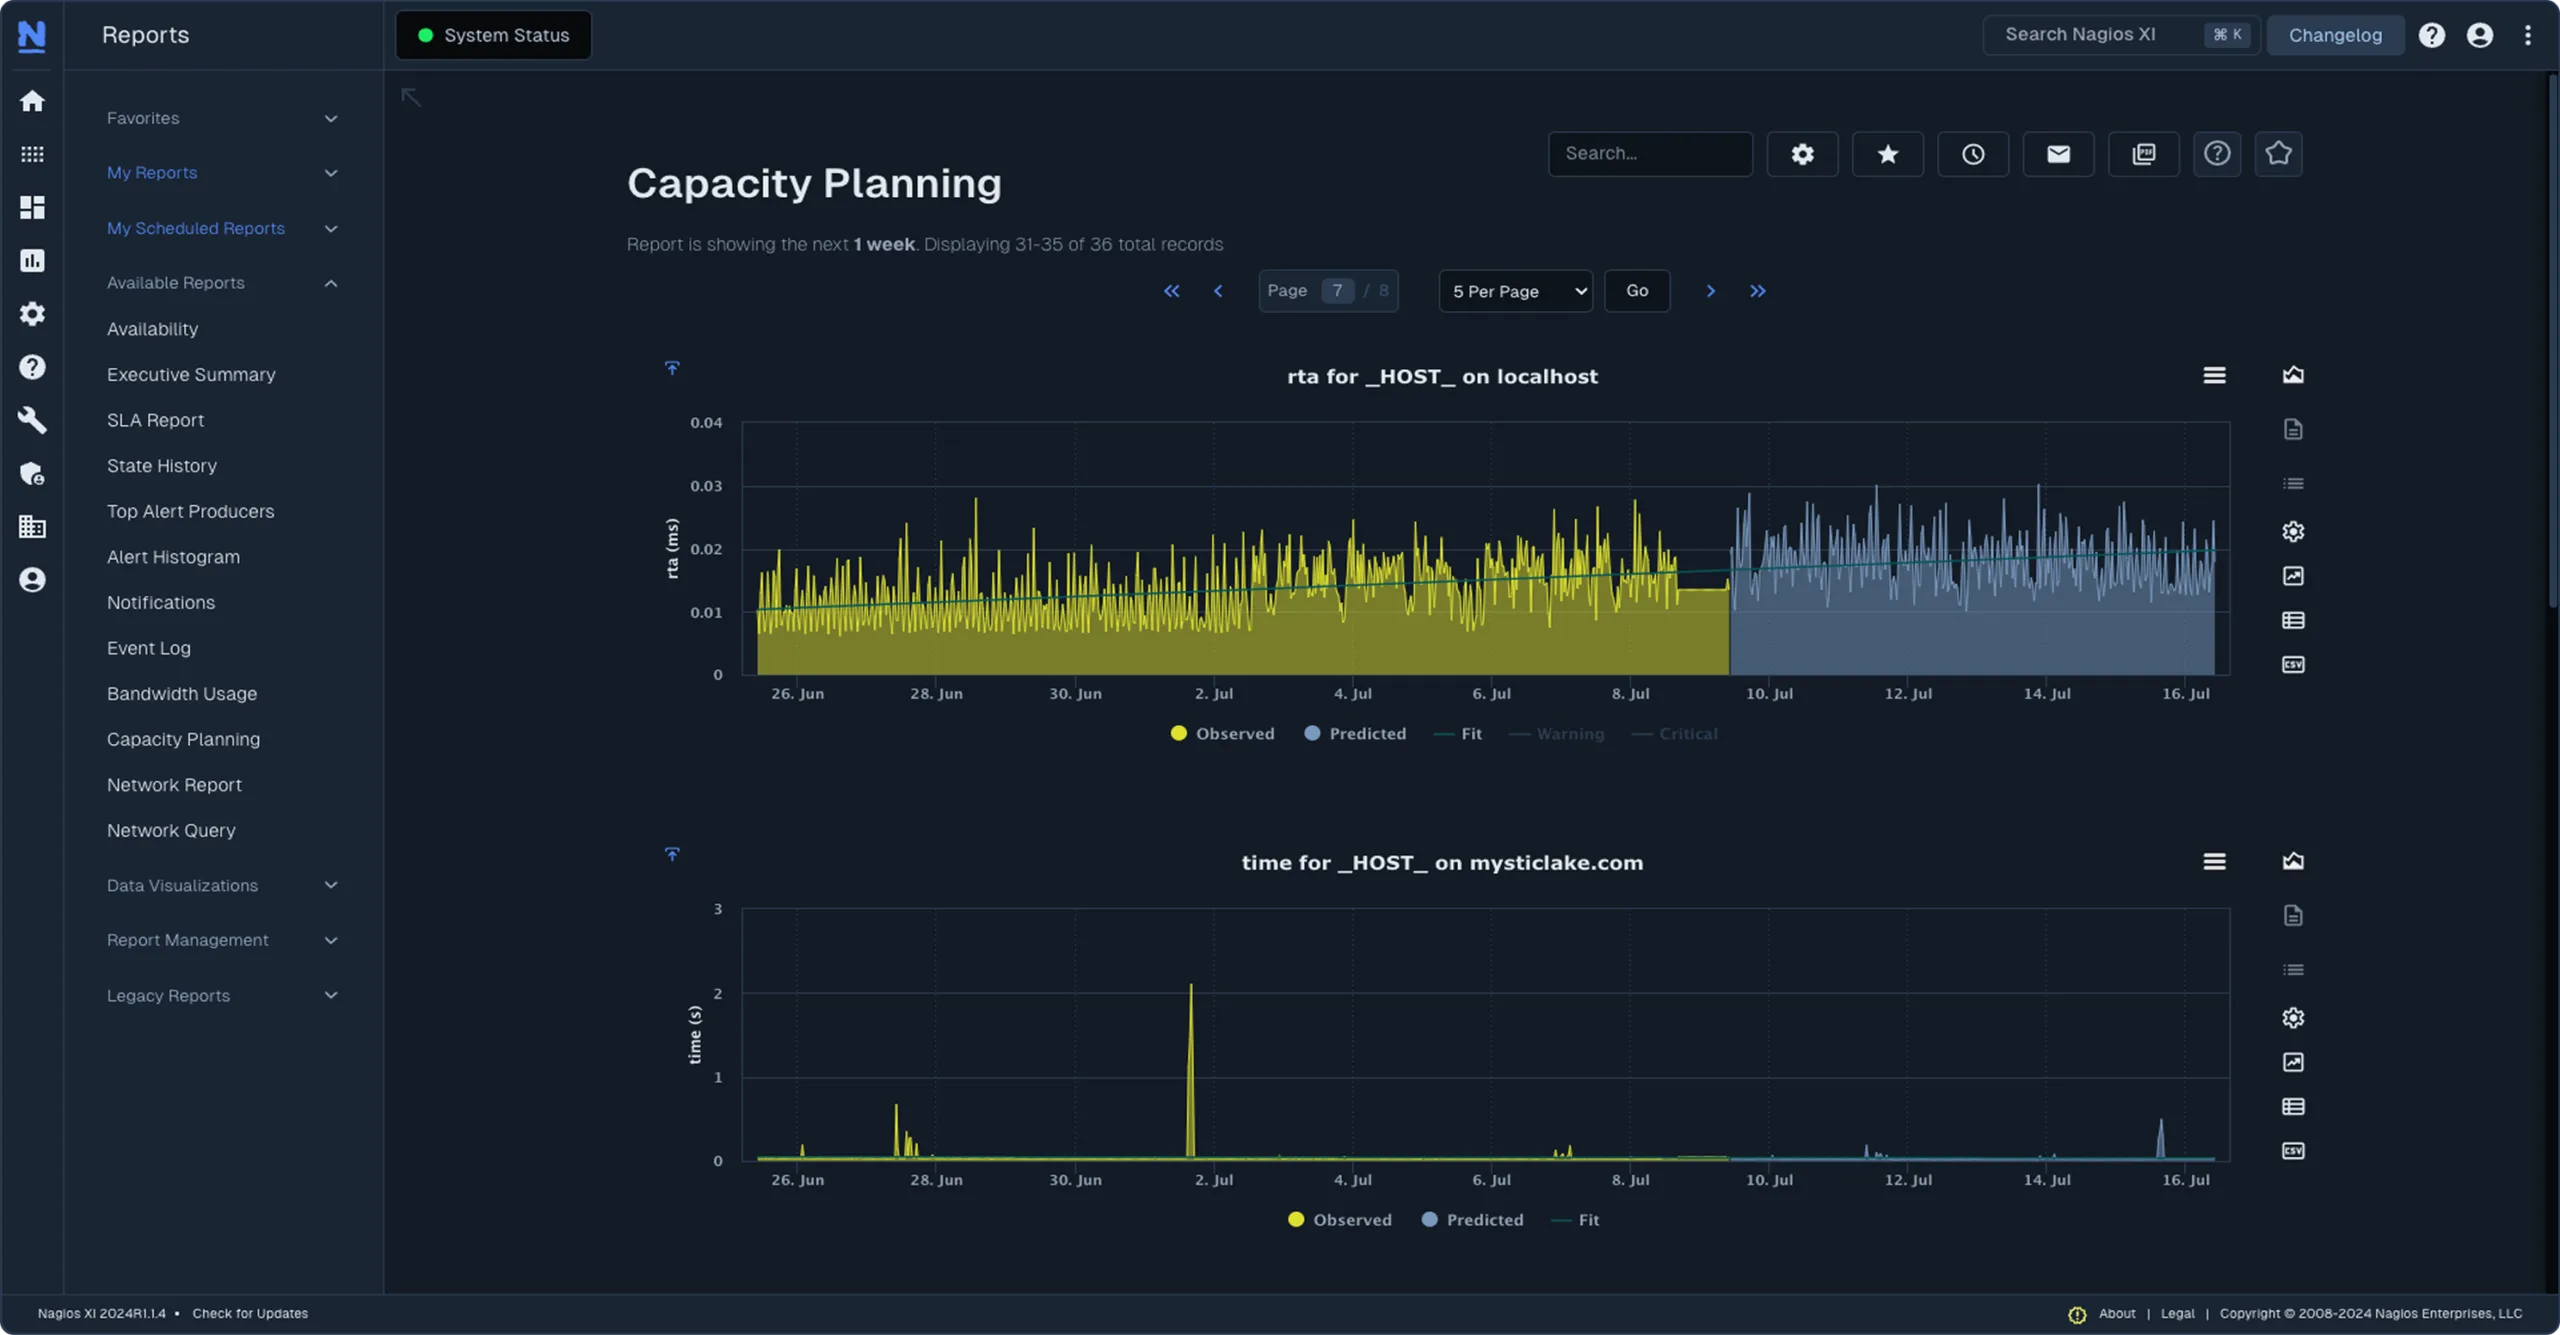
NetFlow, sFlow, J-Flow, and IPFIX records expose unusual activity, off-hours transfers, and volume spikes providing flow-level evidence behind lateral movement and exfiltration.
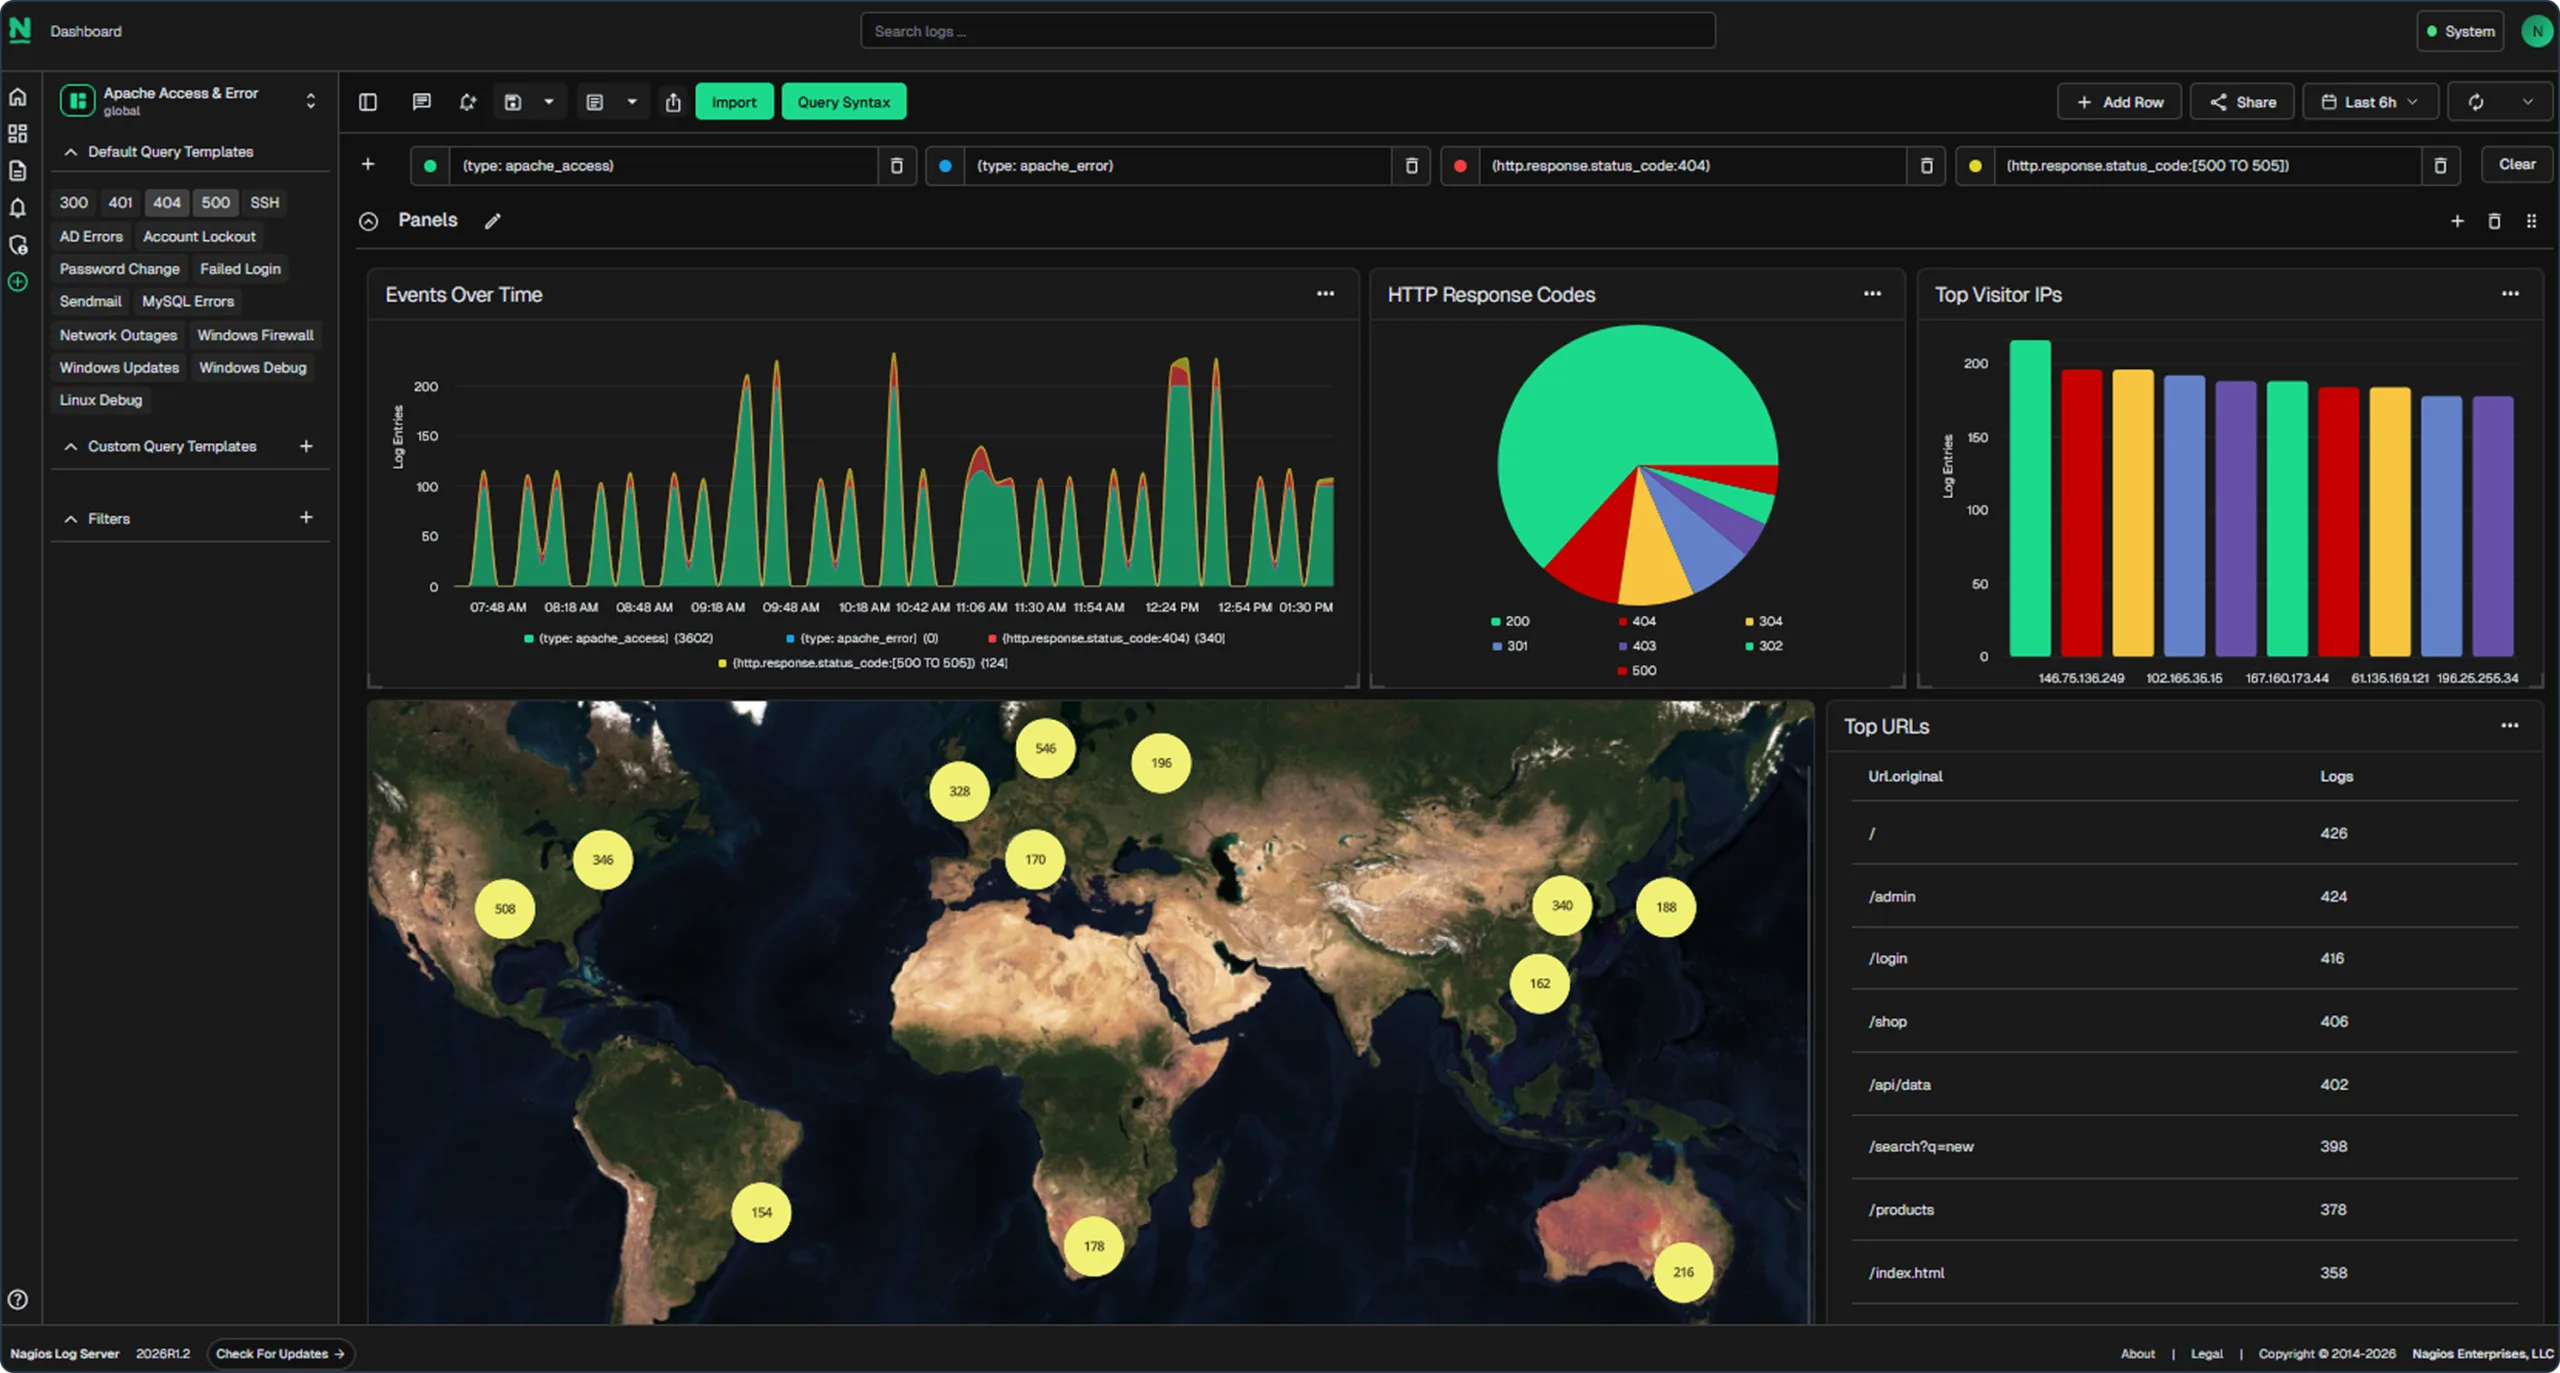
Retained, searchable logs of failed logins and privilege changes let you rebuild an incident timeline and export the documentation auditors actually ask for.
The Nagios Networking Toolkit follows a problem down through every layer in one connected workflow. Device status tells you what changed, flow data tells you who's talking, and syslog tells you what the hardware reported on its way down.
Explore the Networking Toolkit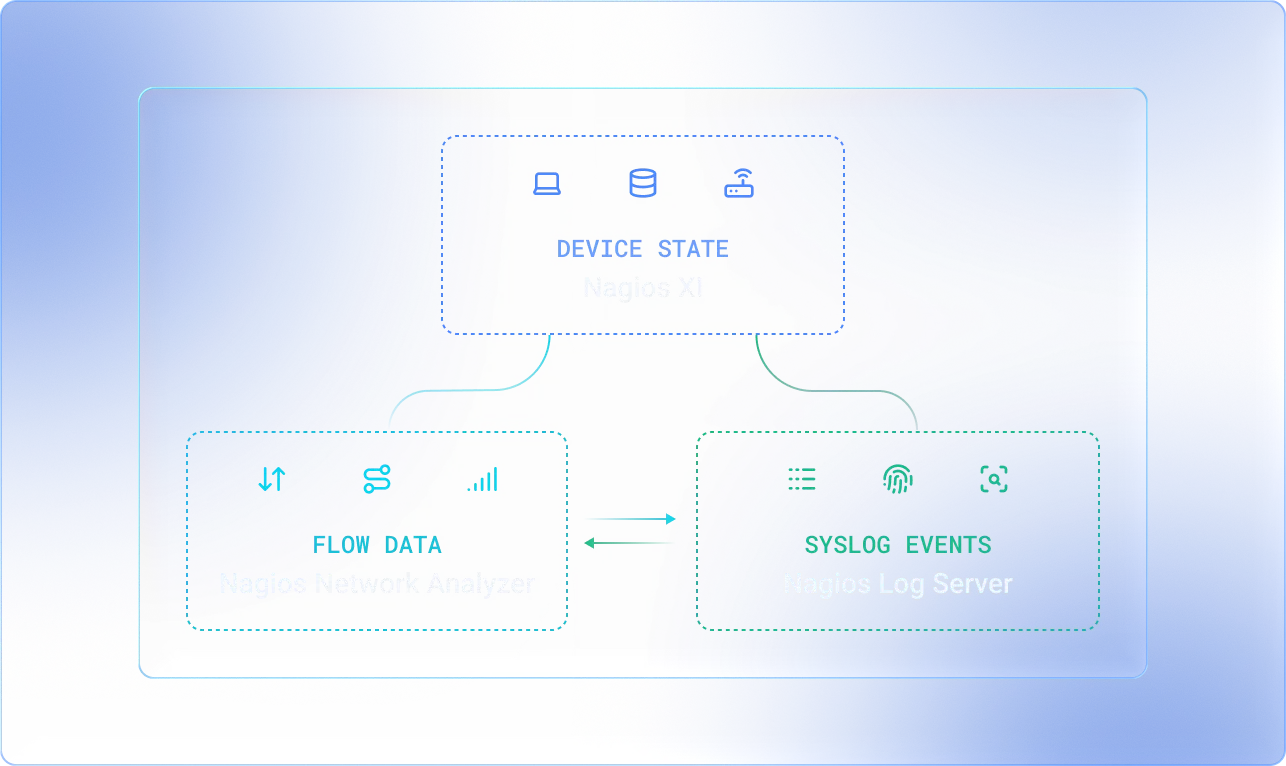
Switches, routers, firewalls, and servers via SNMP, agents, WMI, or SSH. Track interface status, service health, and resource thresholds across your environment.
Top talkers, bandwidth trends, and protocol usage down to the individual flow. Plan capacity and answer “the network is slow” with data.
Syslog from servers, firewalls, and network devices lands next to your monitoring timeline, so you can read what a device reported in the minutes before it dropped.